Sketchplanations
Big Ideas Little Pictures

Sketchplanations in a book! I think you'll love Big Ideas Little Pictures

Sketchplanations podcast photo of Rob Bell, Tom Pellereau and Jono Hey

Prefer to listen?
Try the podcast

Like Sketchplanations?
Support me on Patreon

Framework sketches

Explore sketches, drawings, and illustrations that simplify ideas related to Framework.

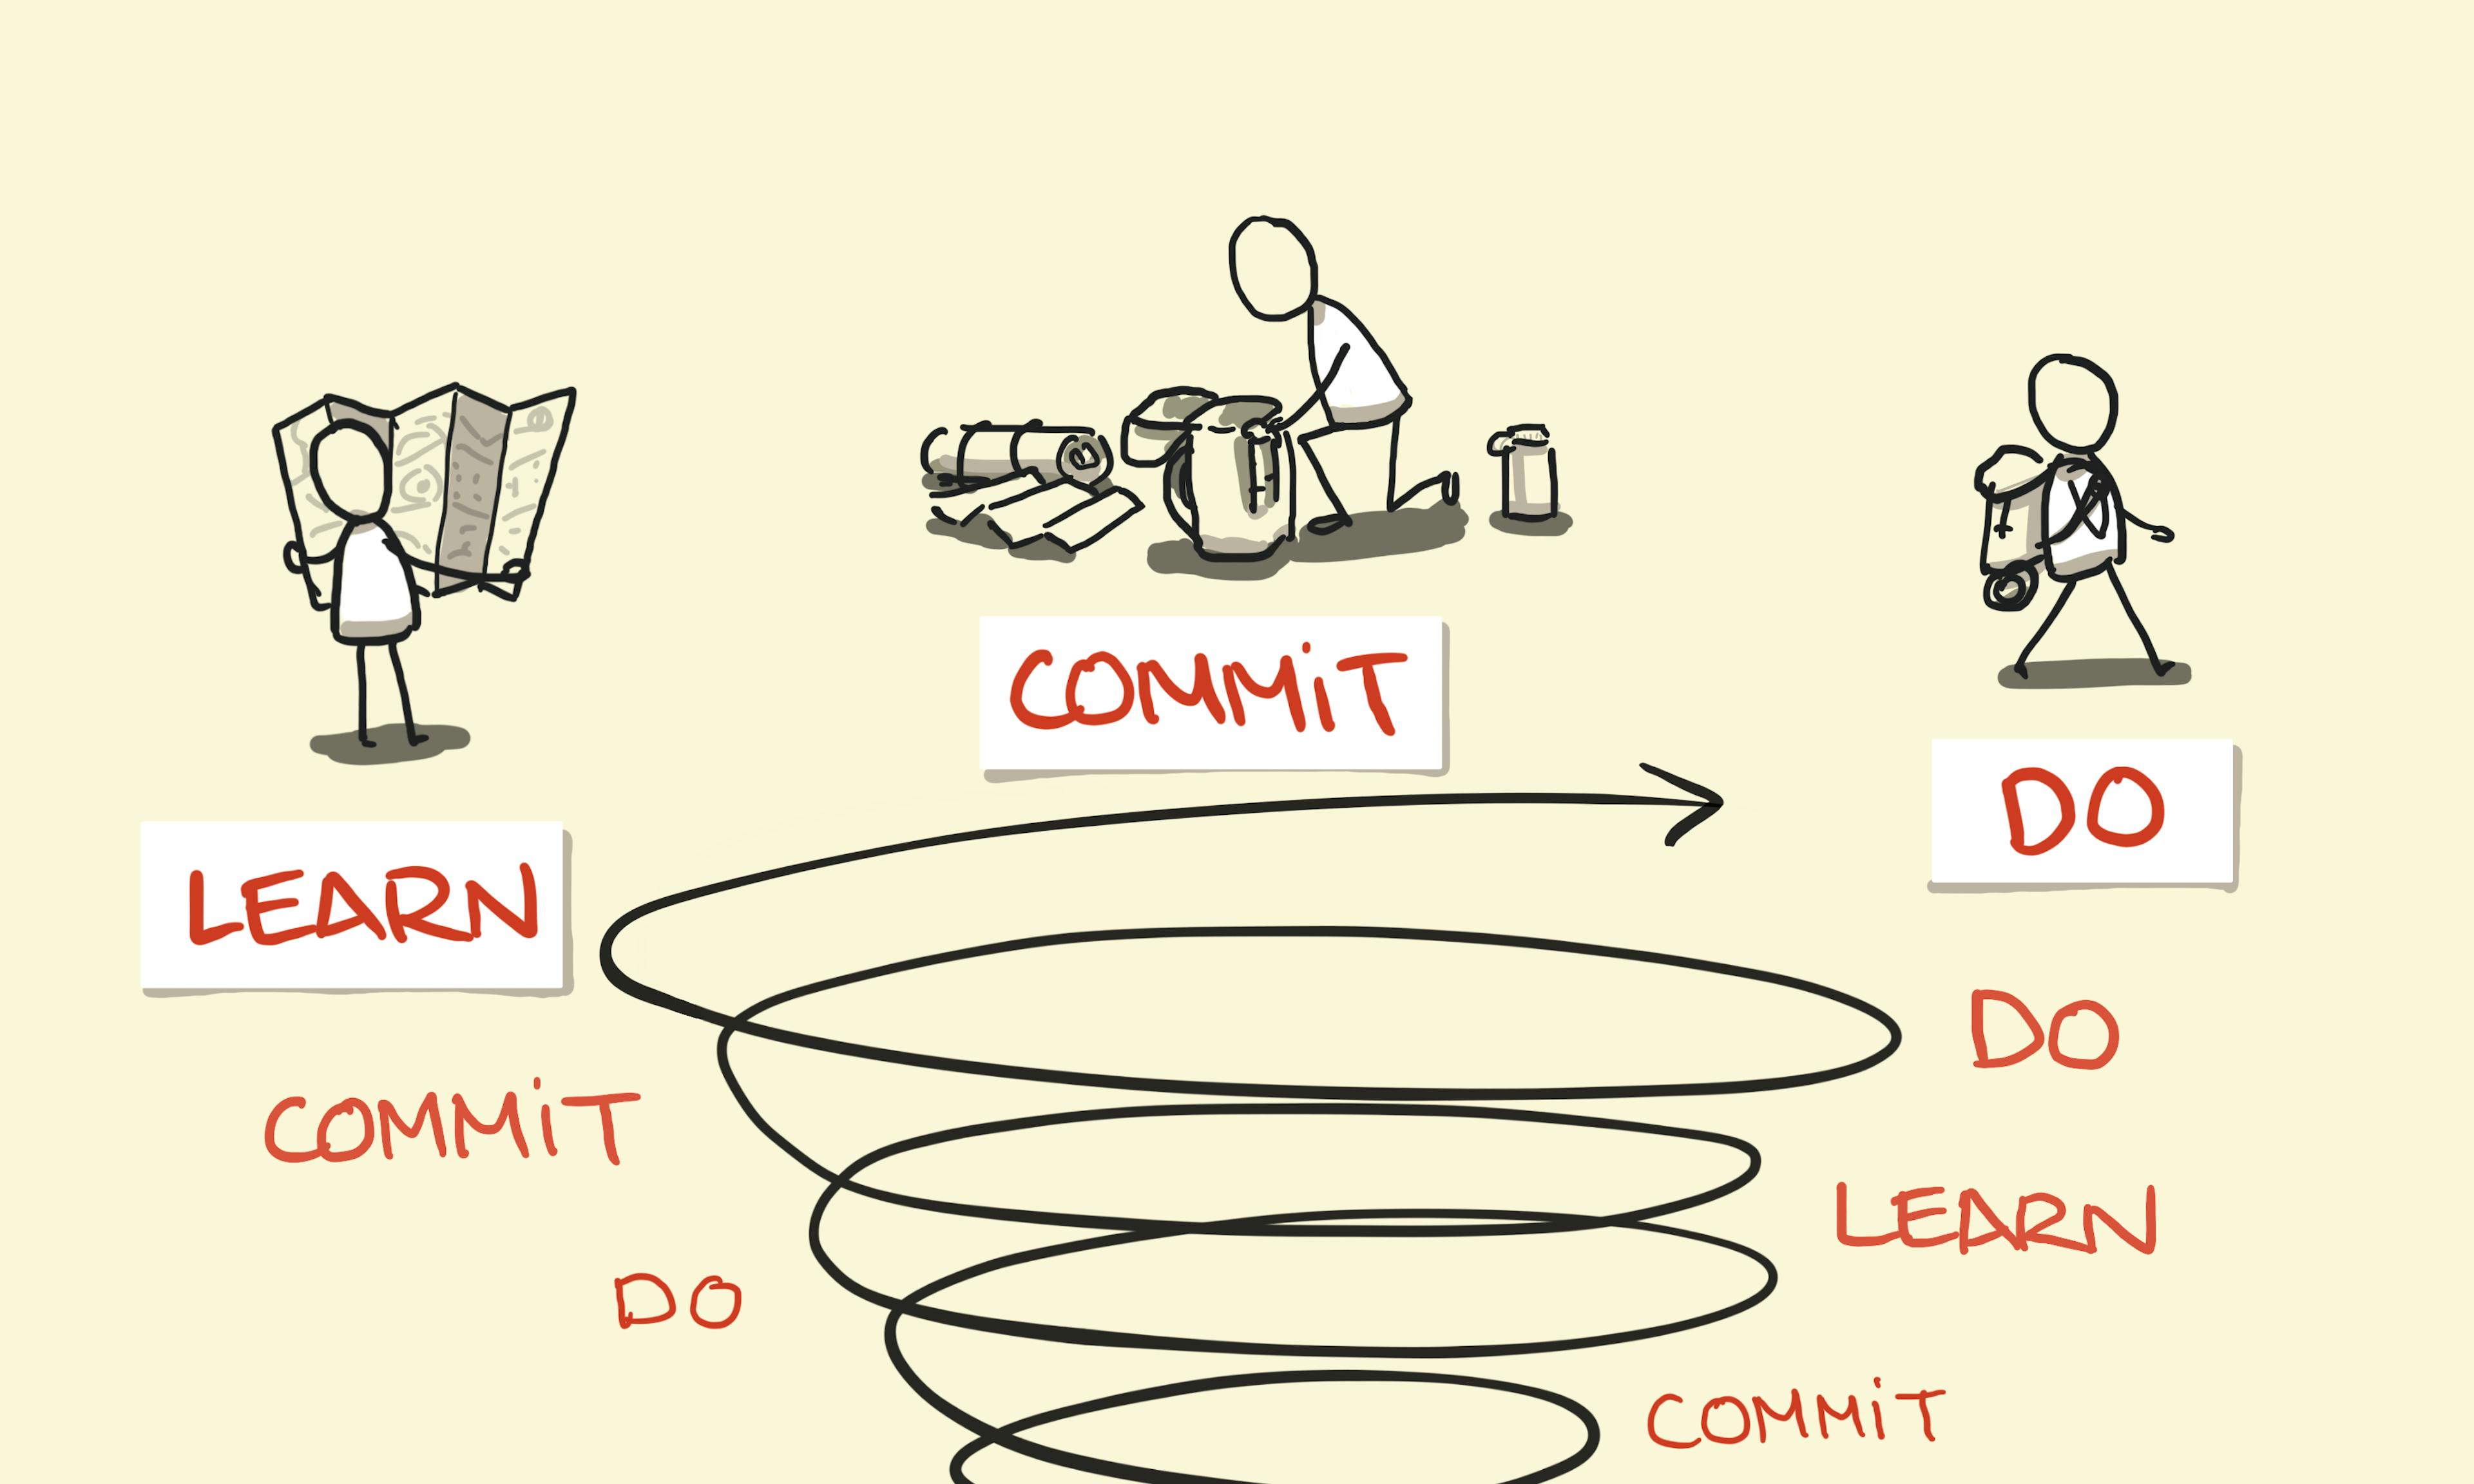
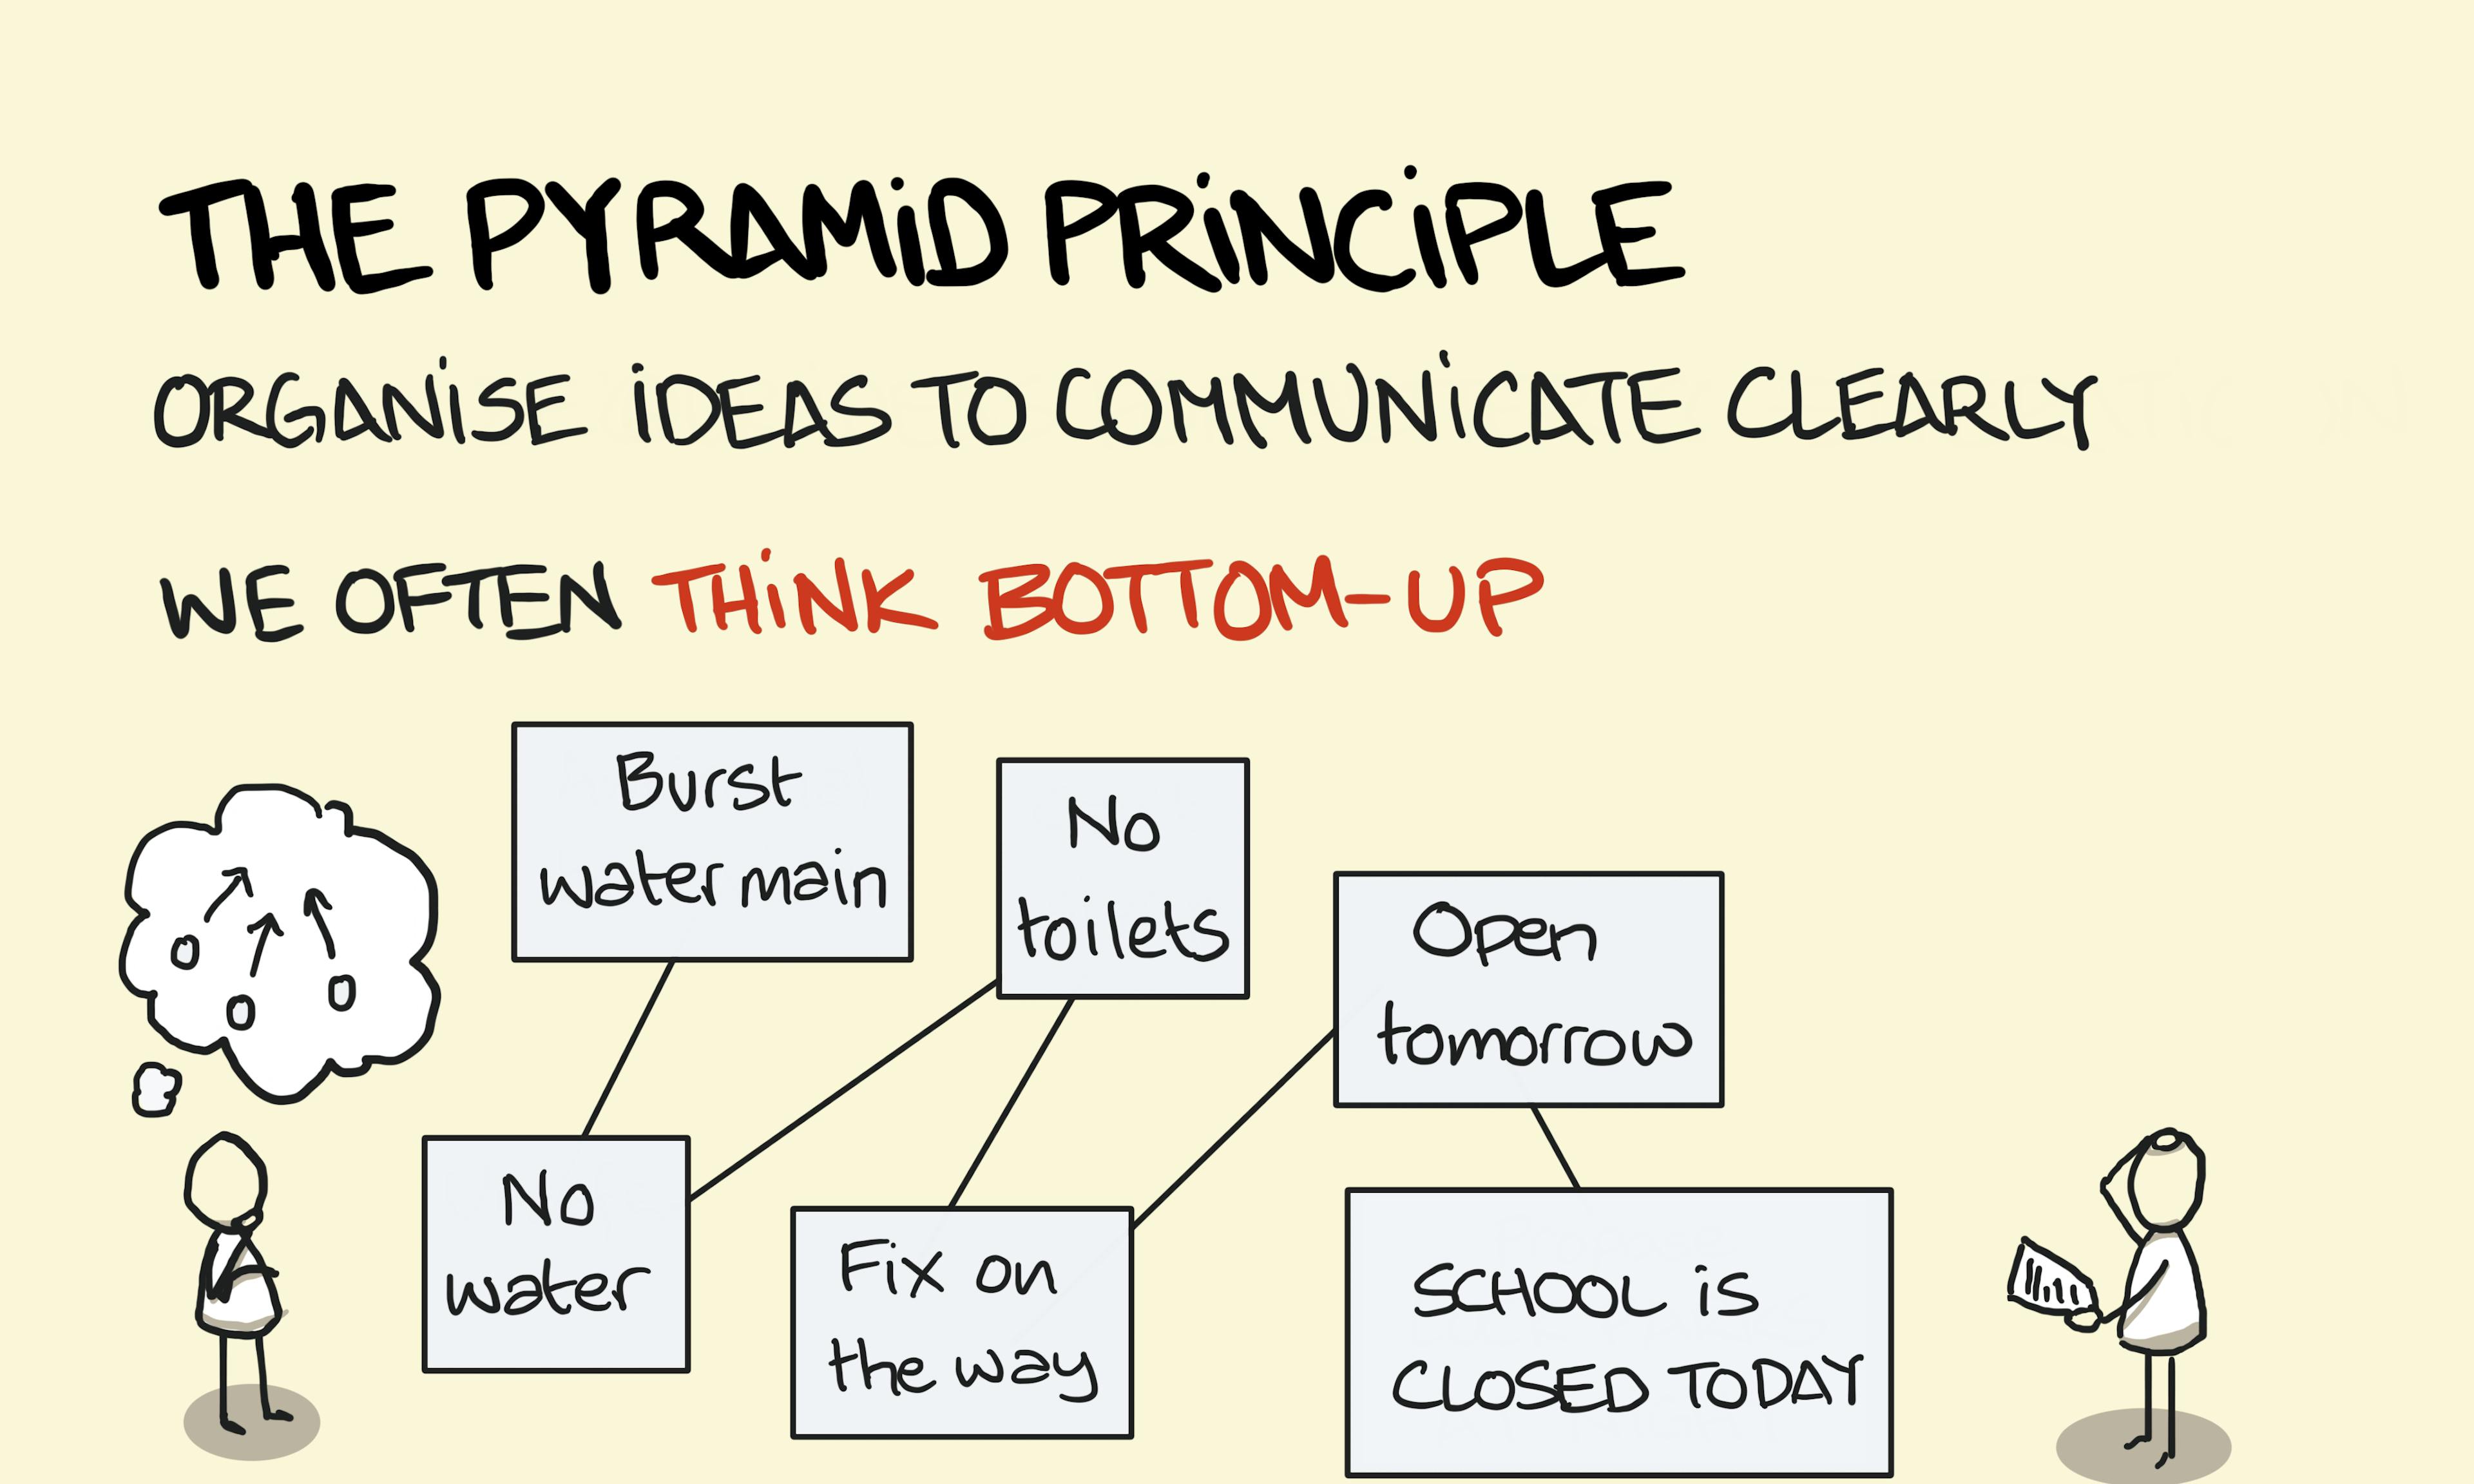
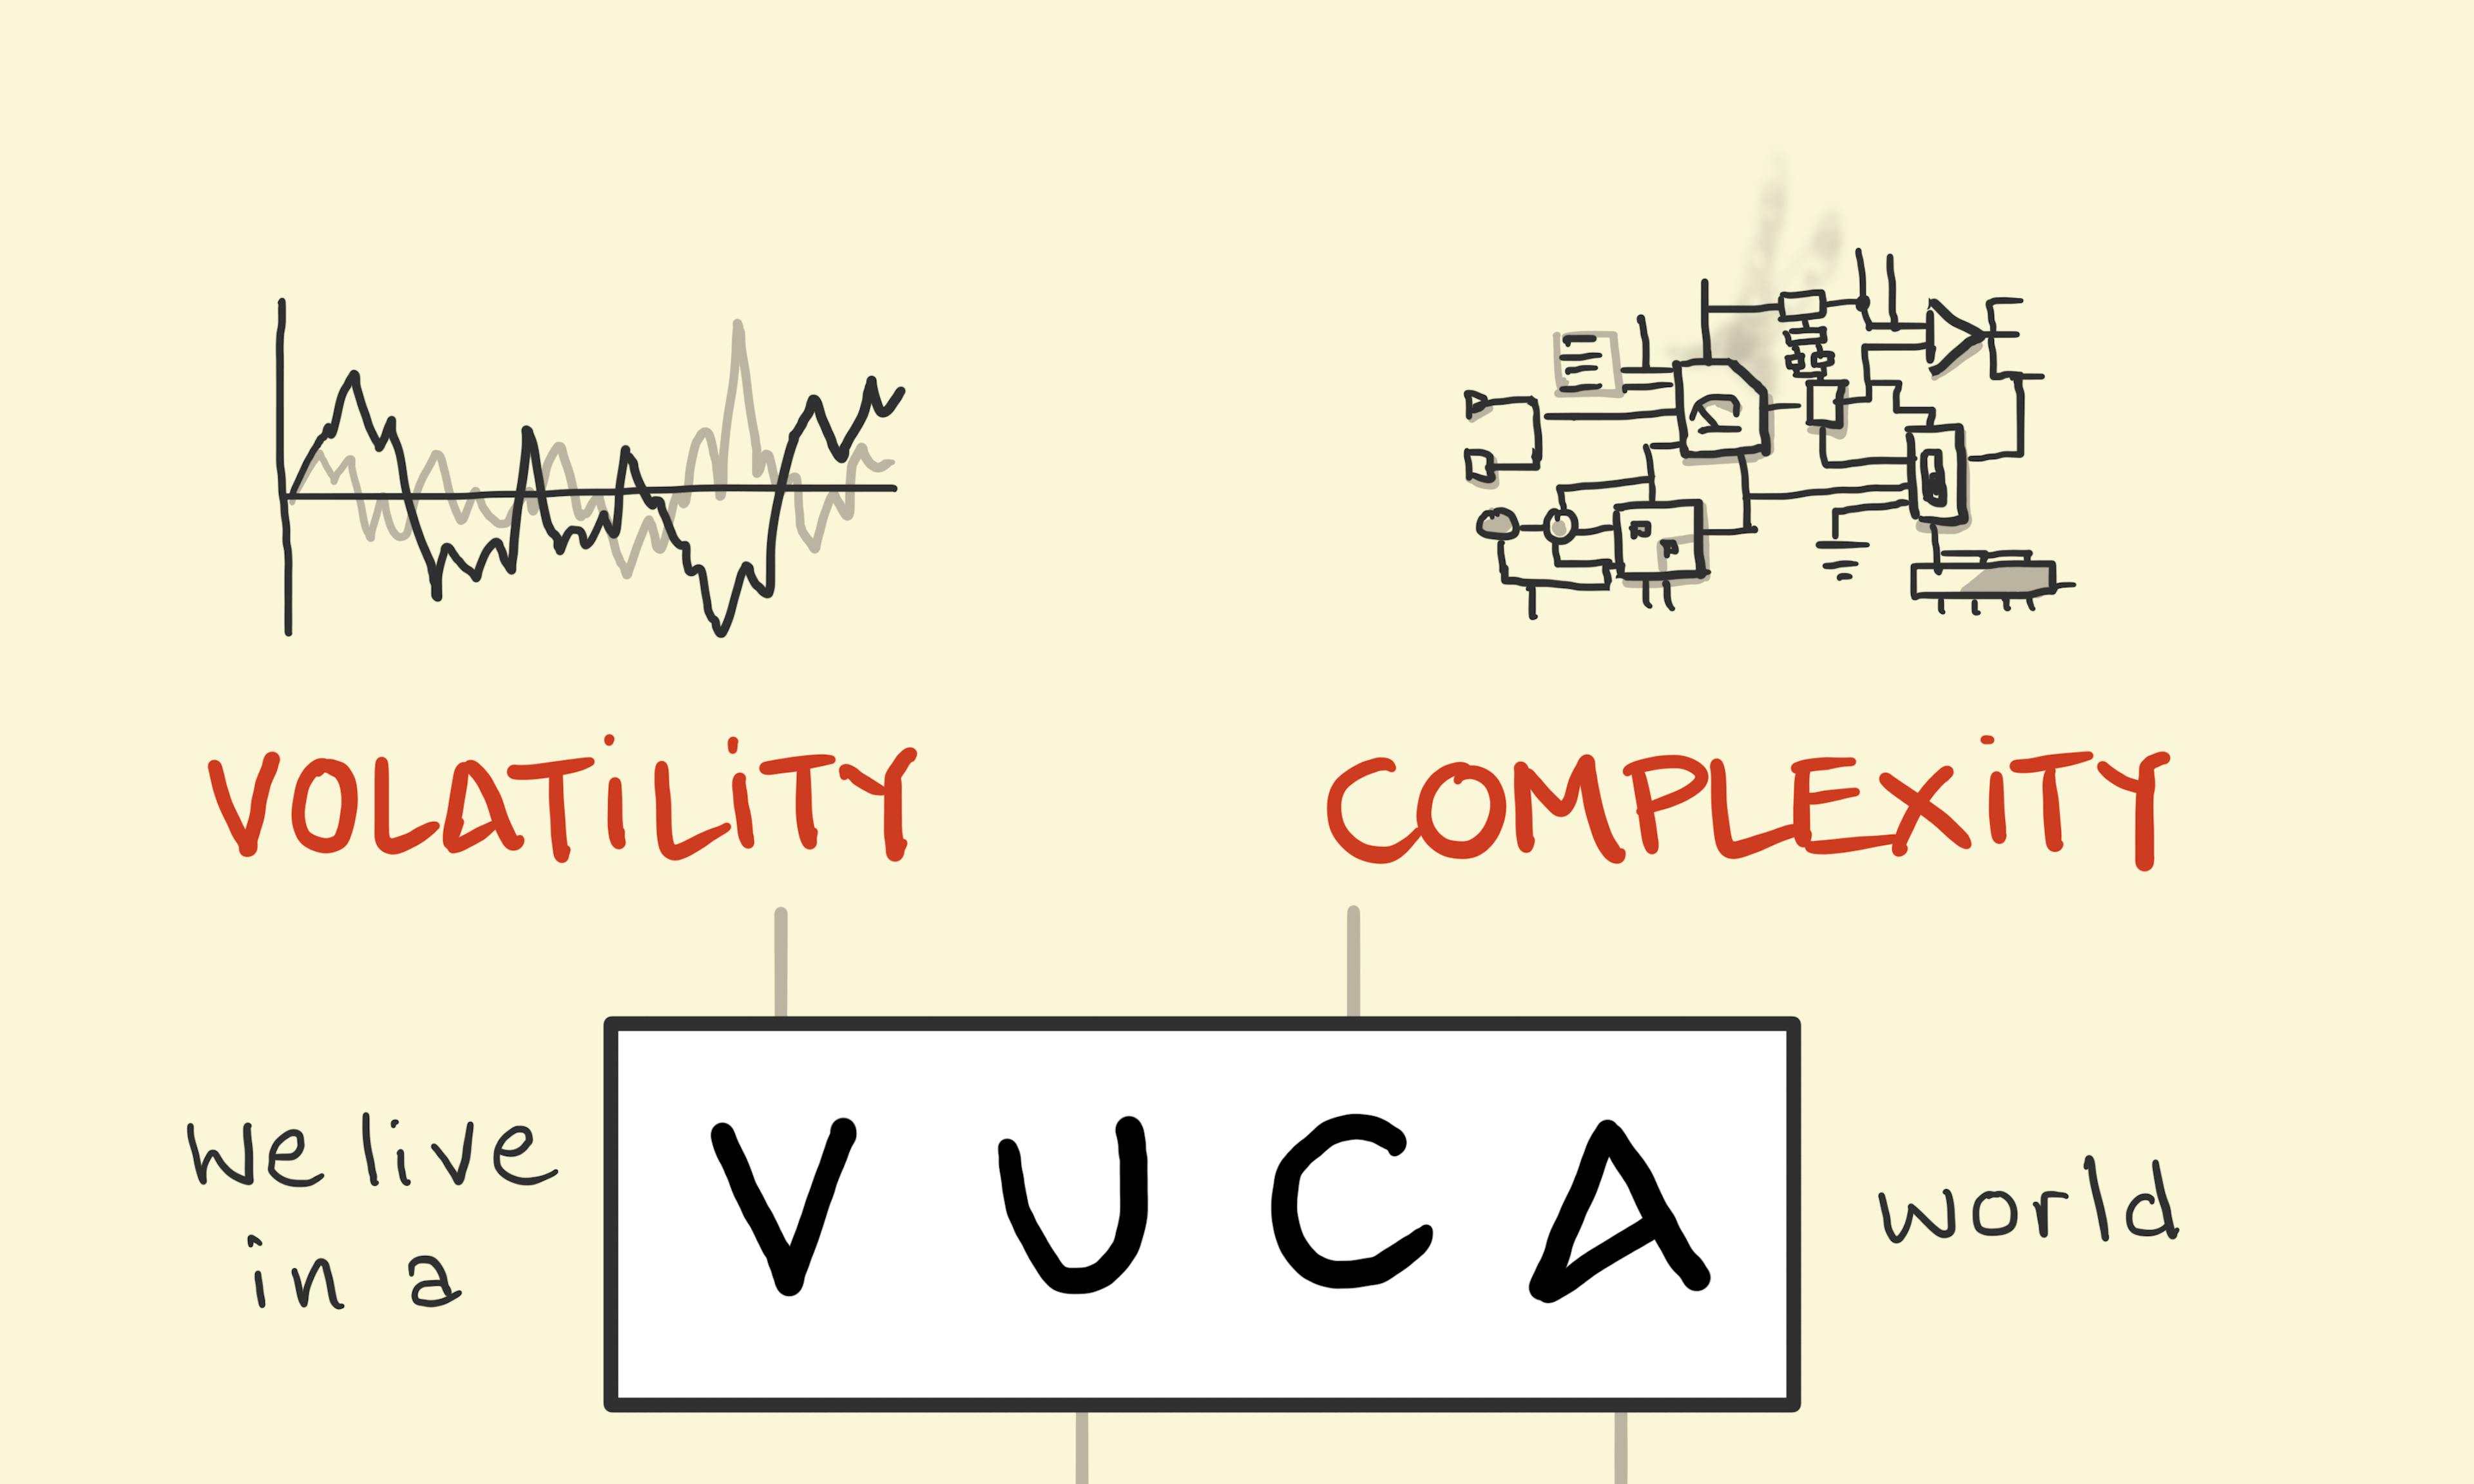
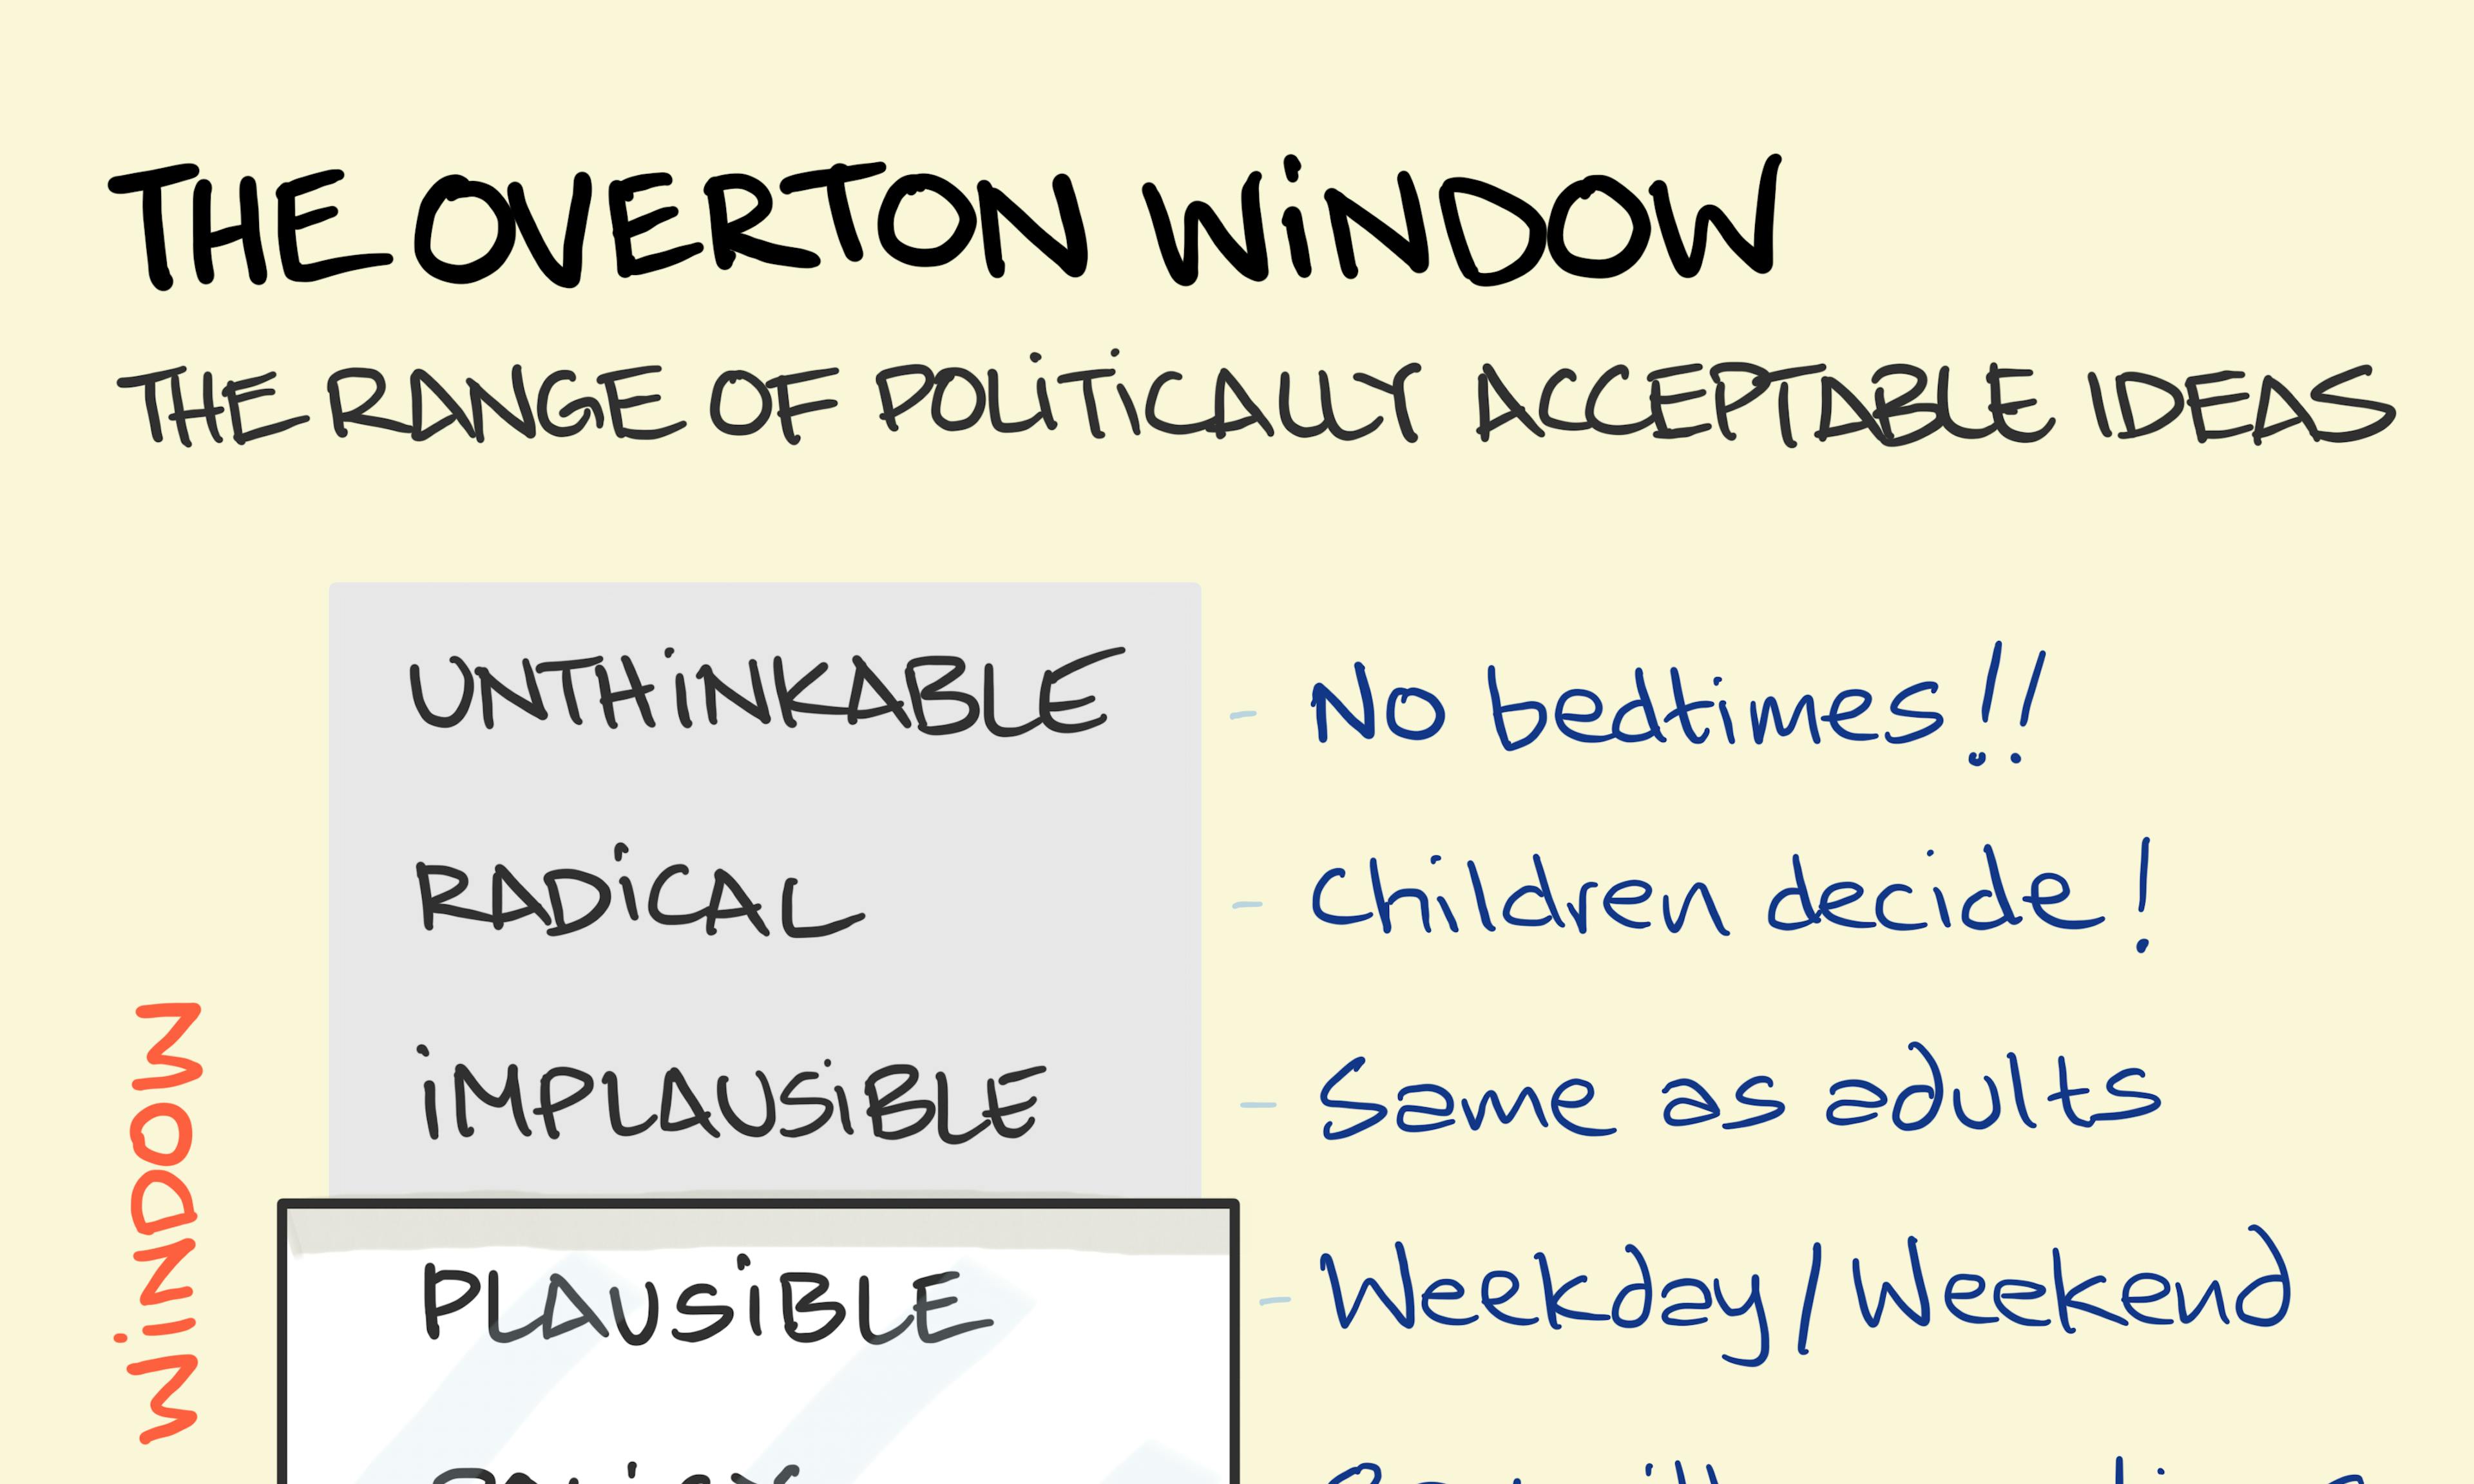
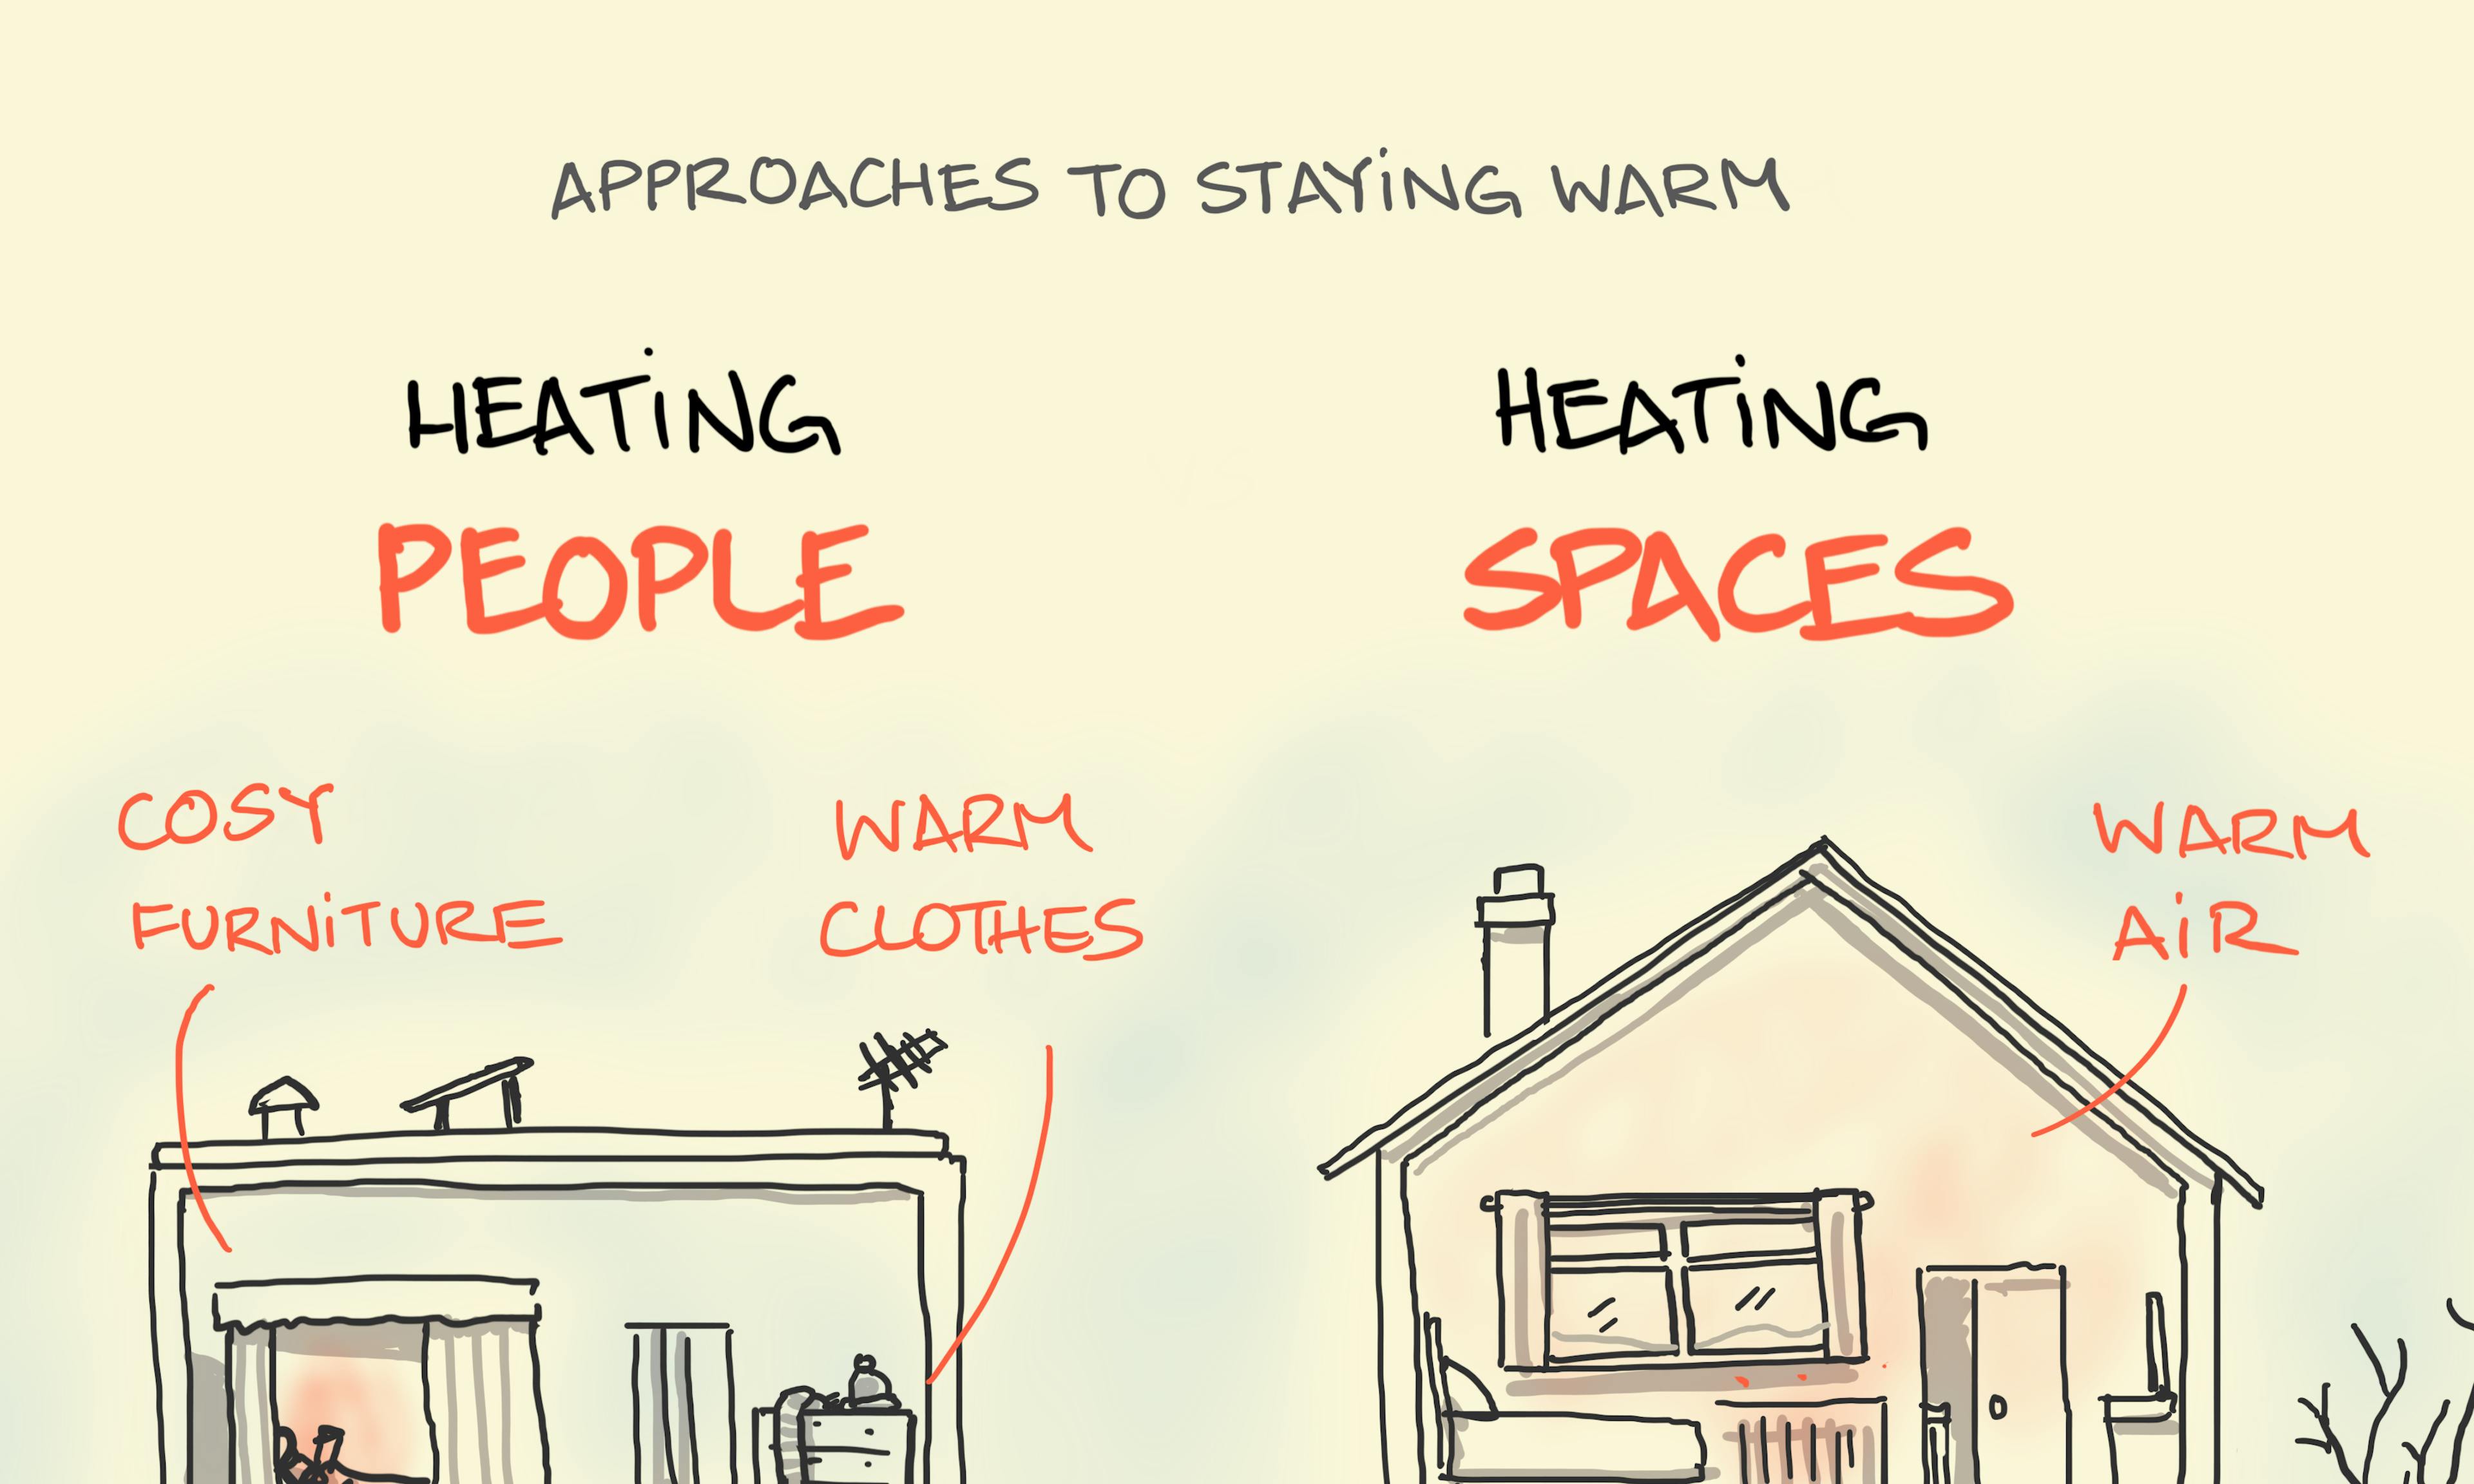
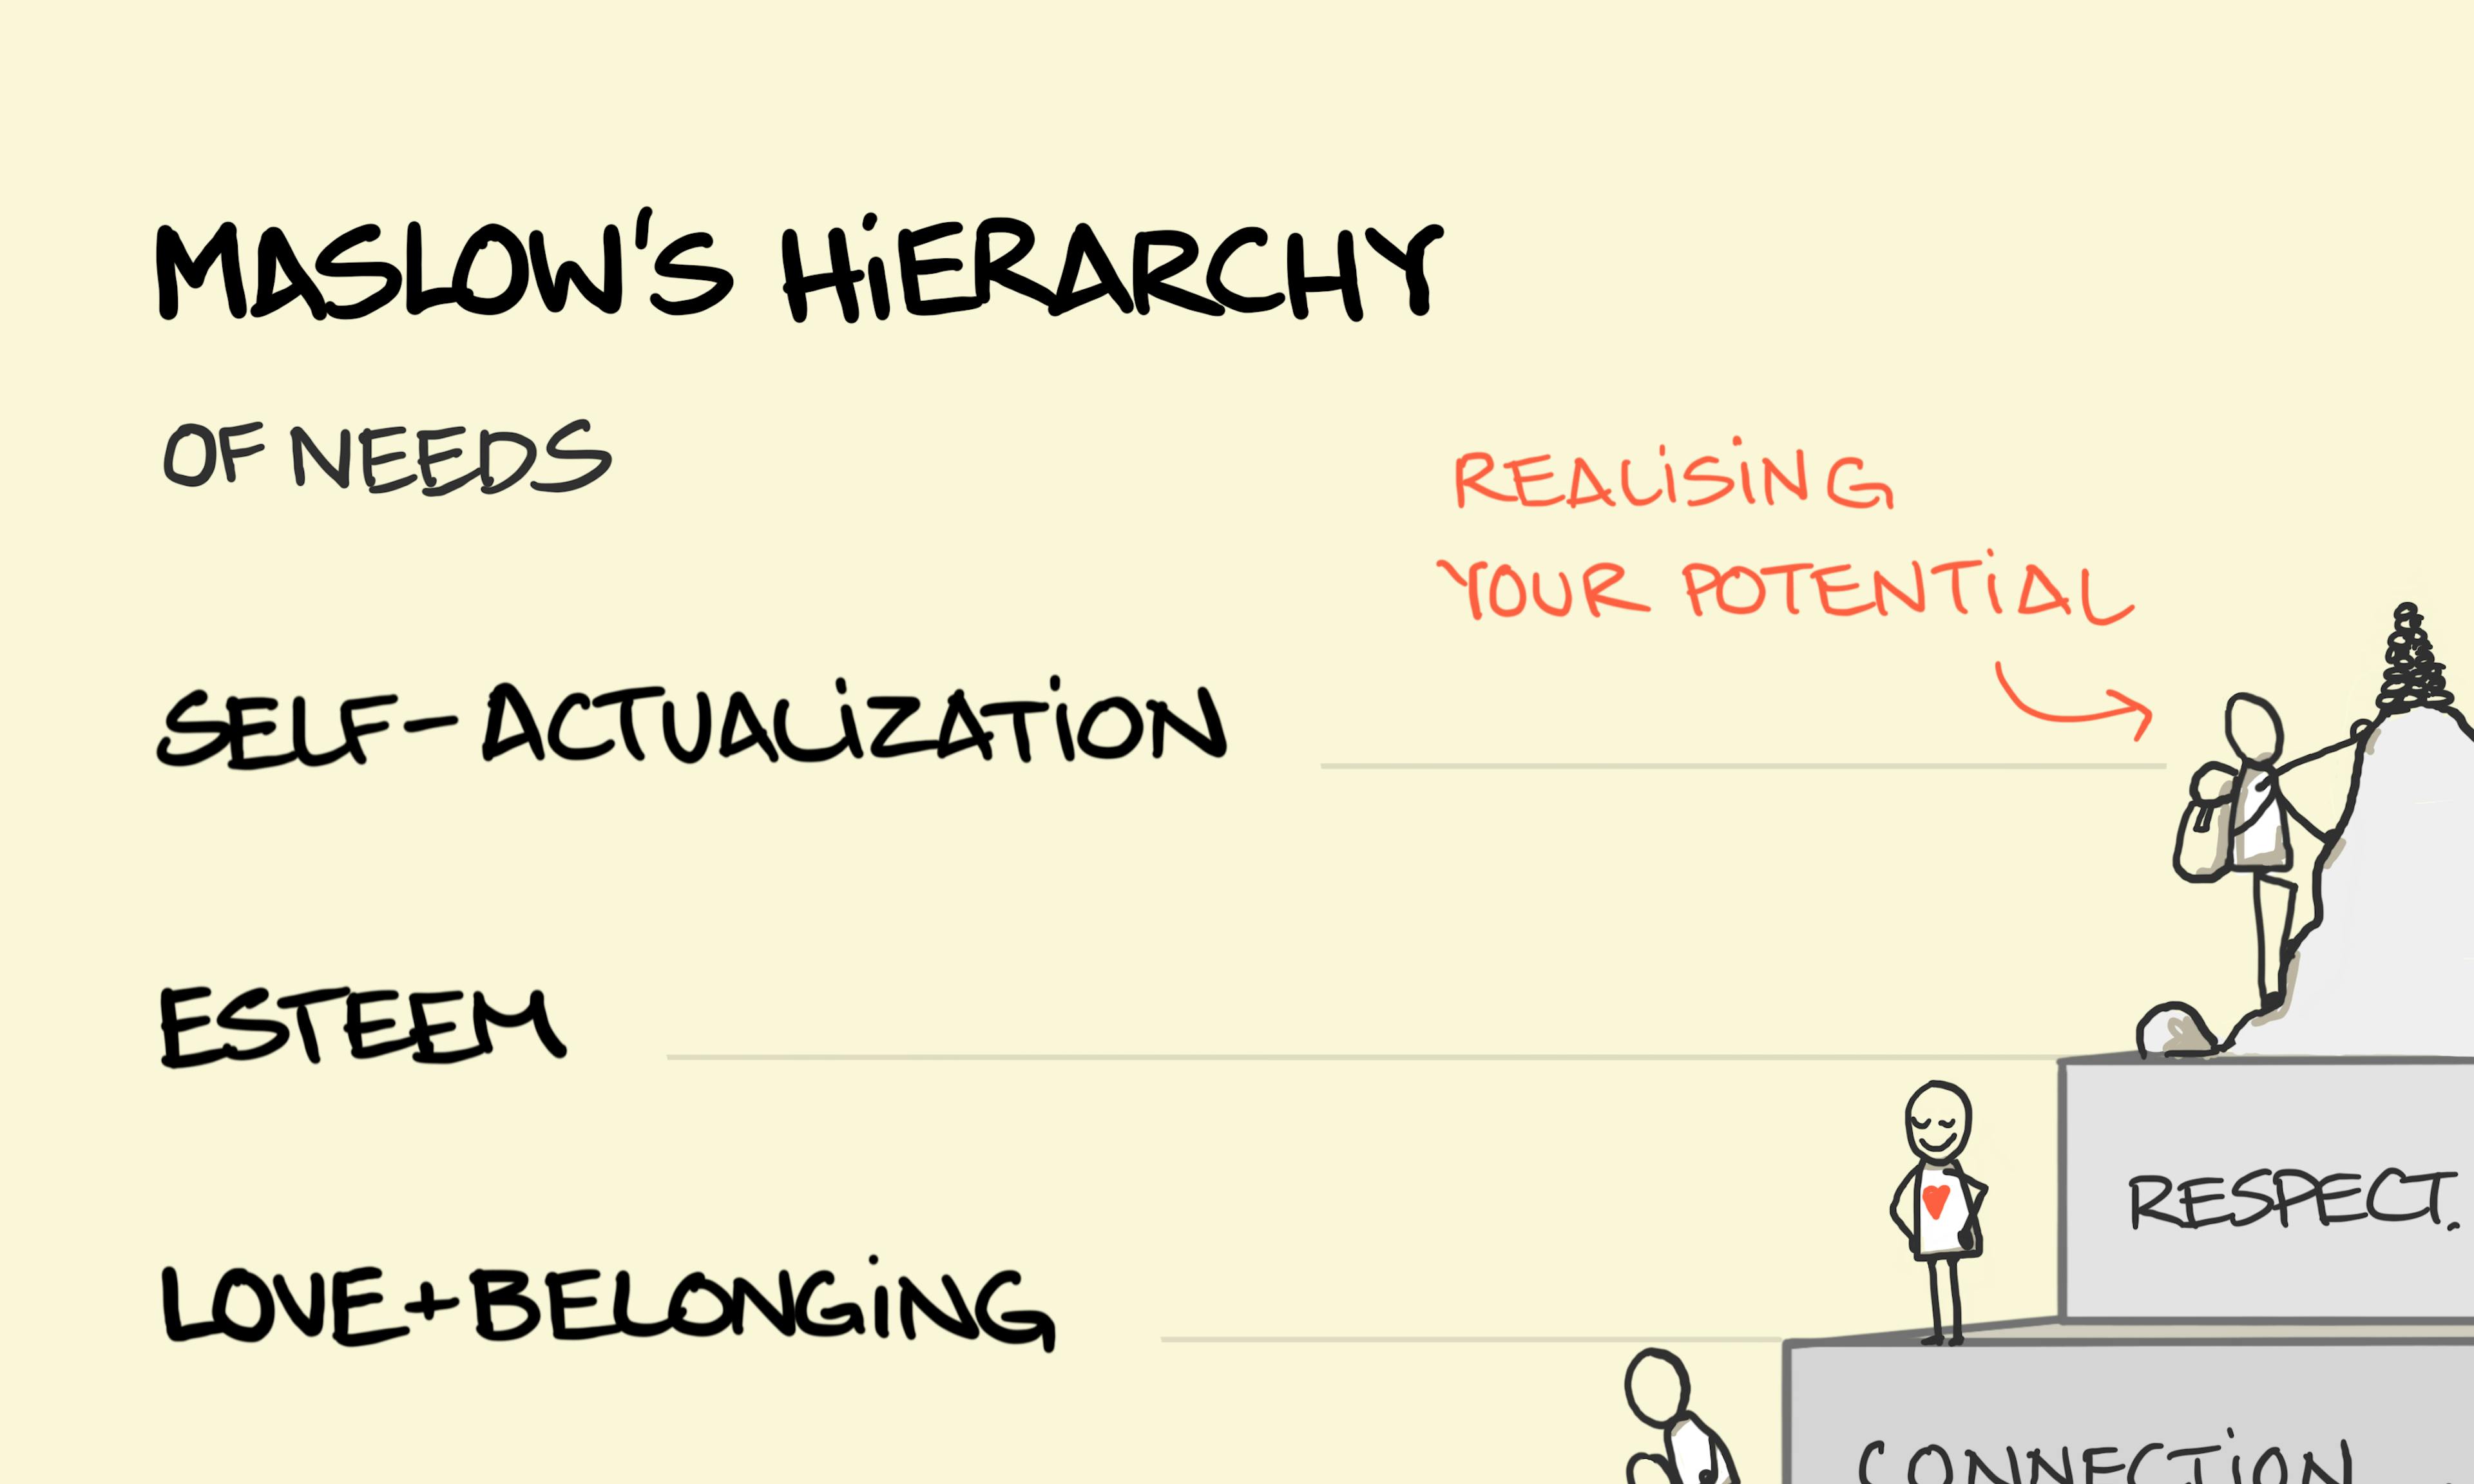
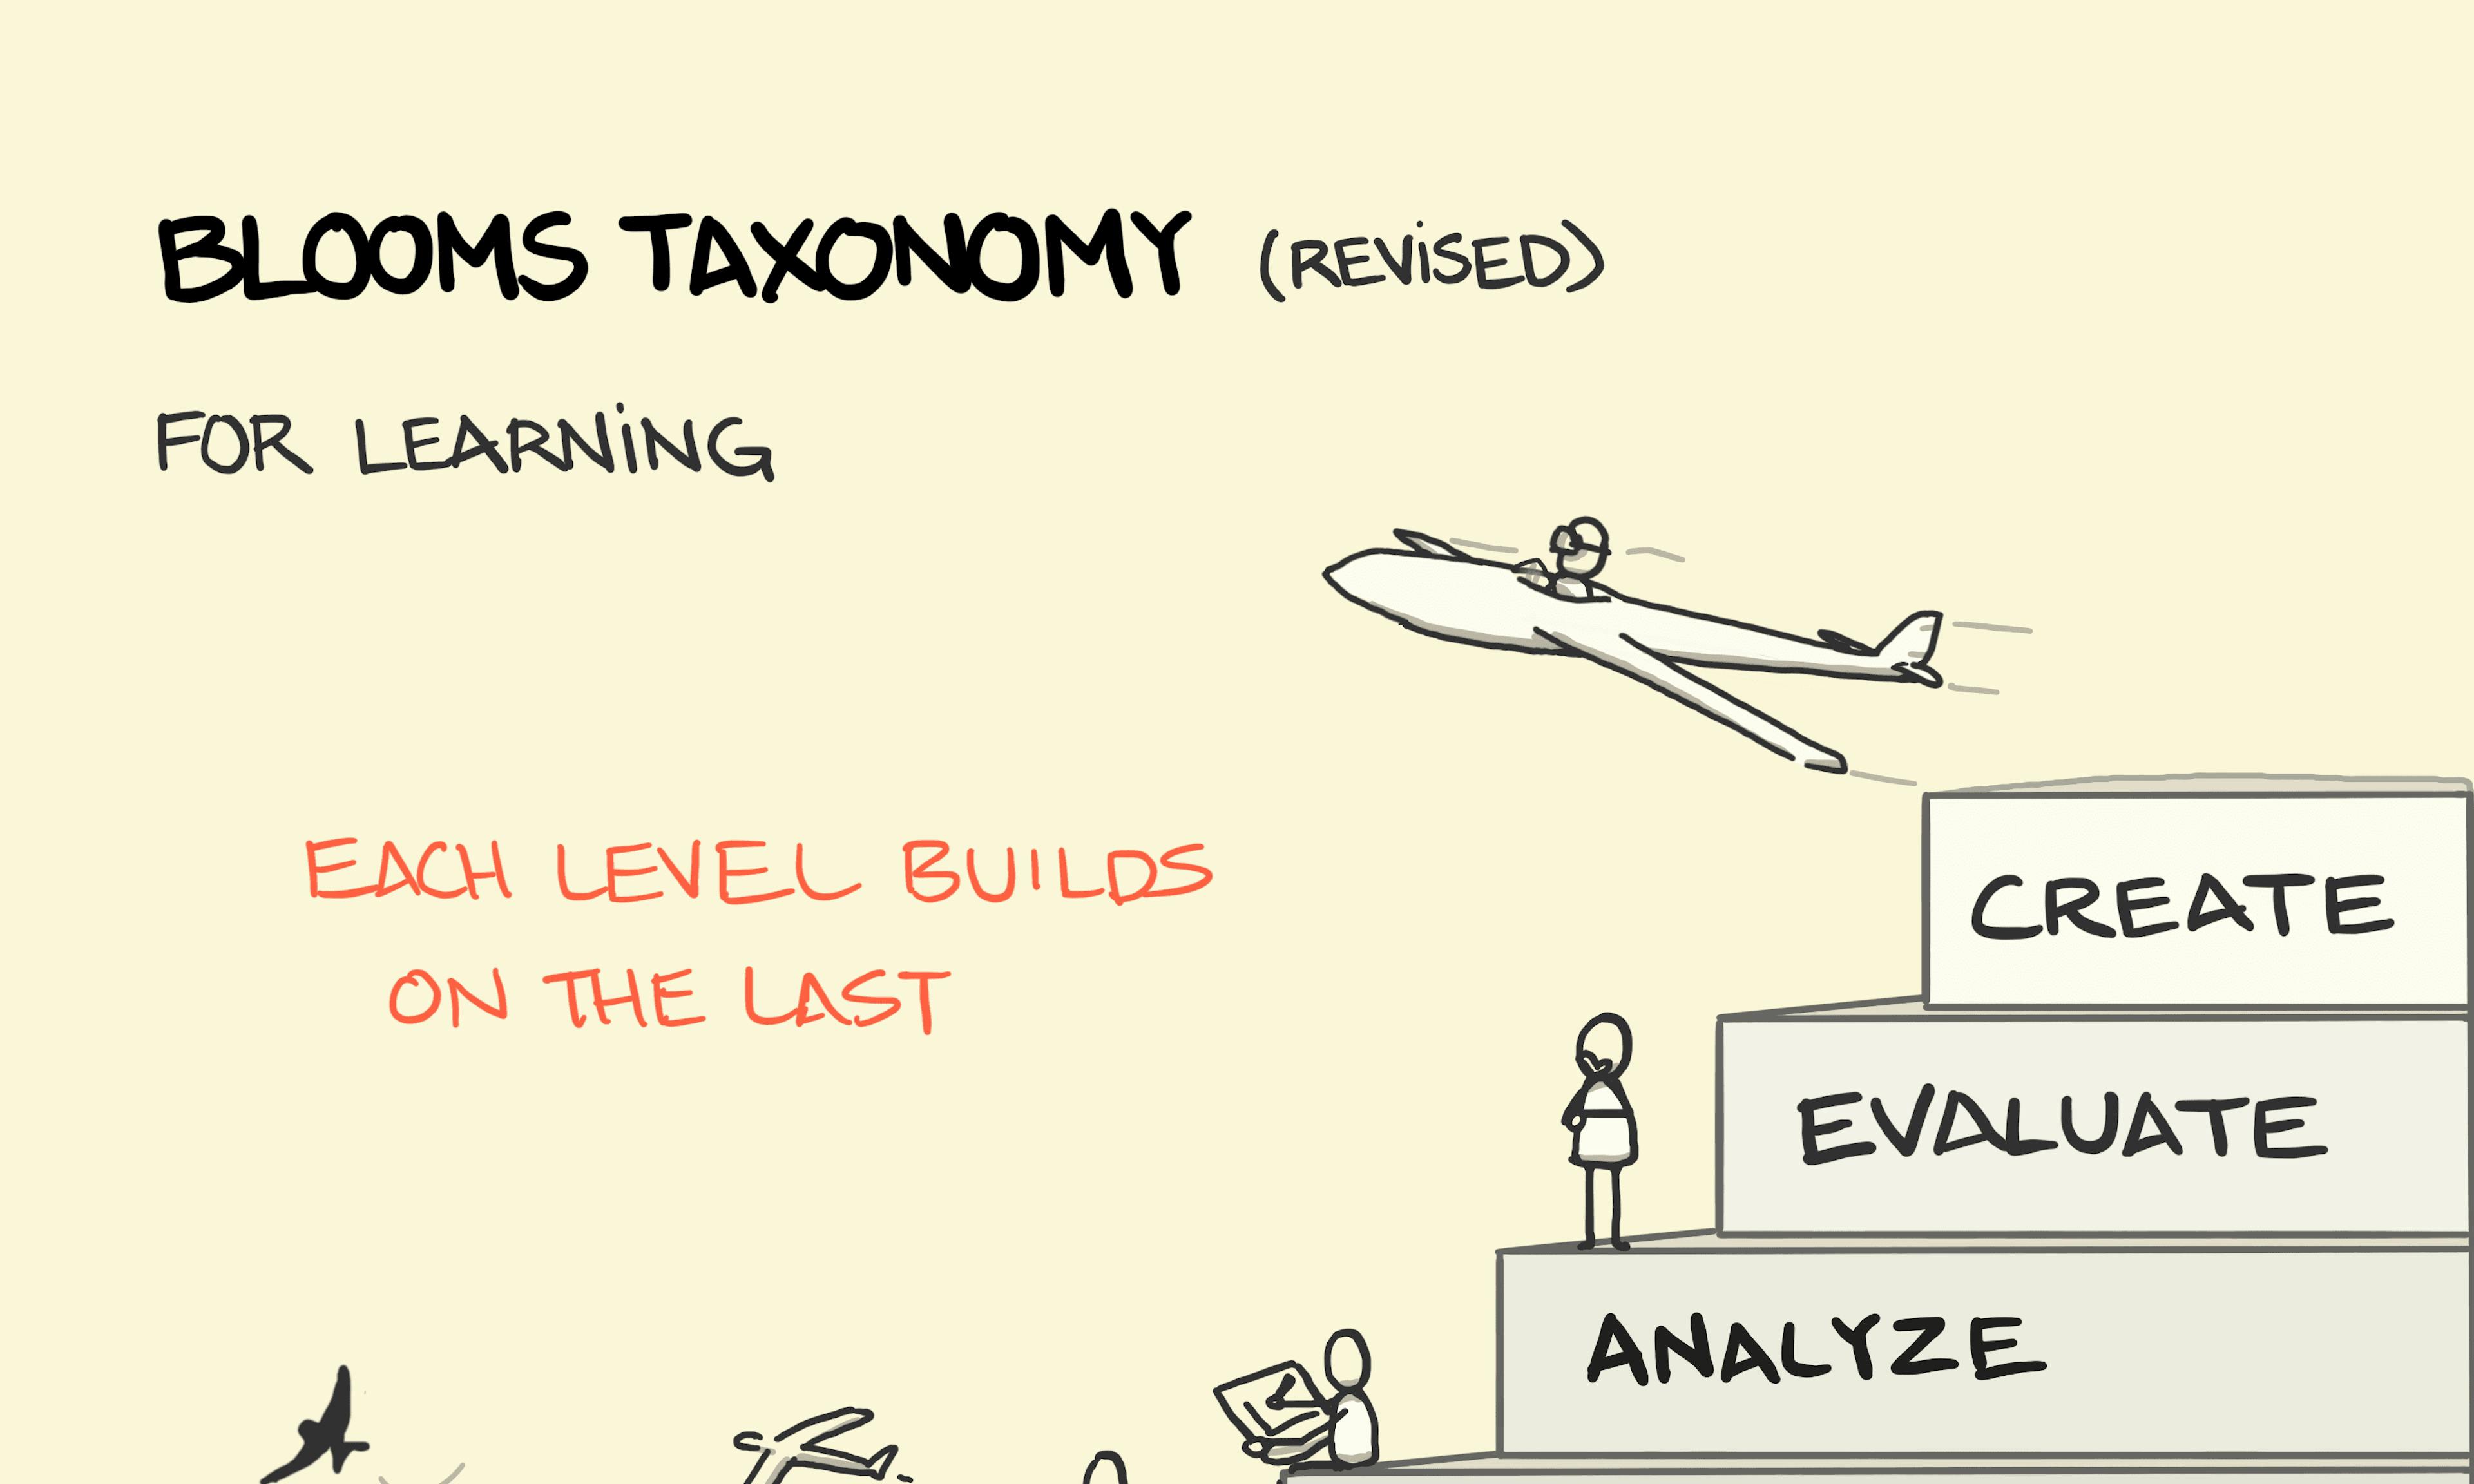
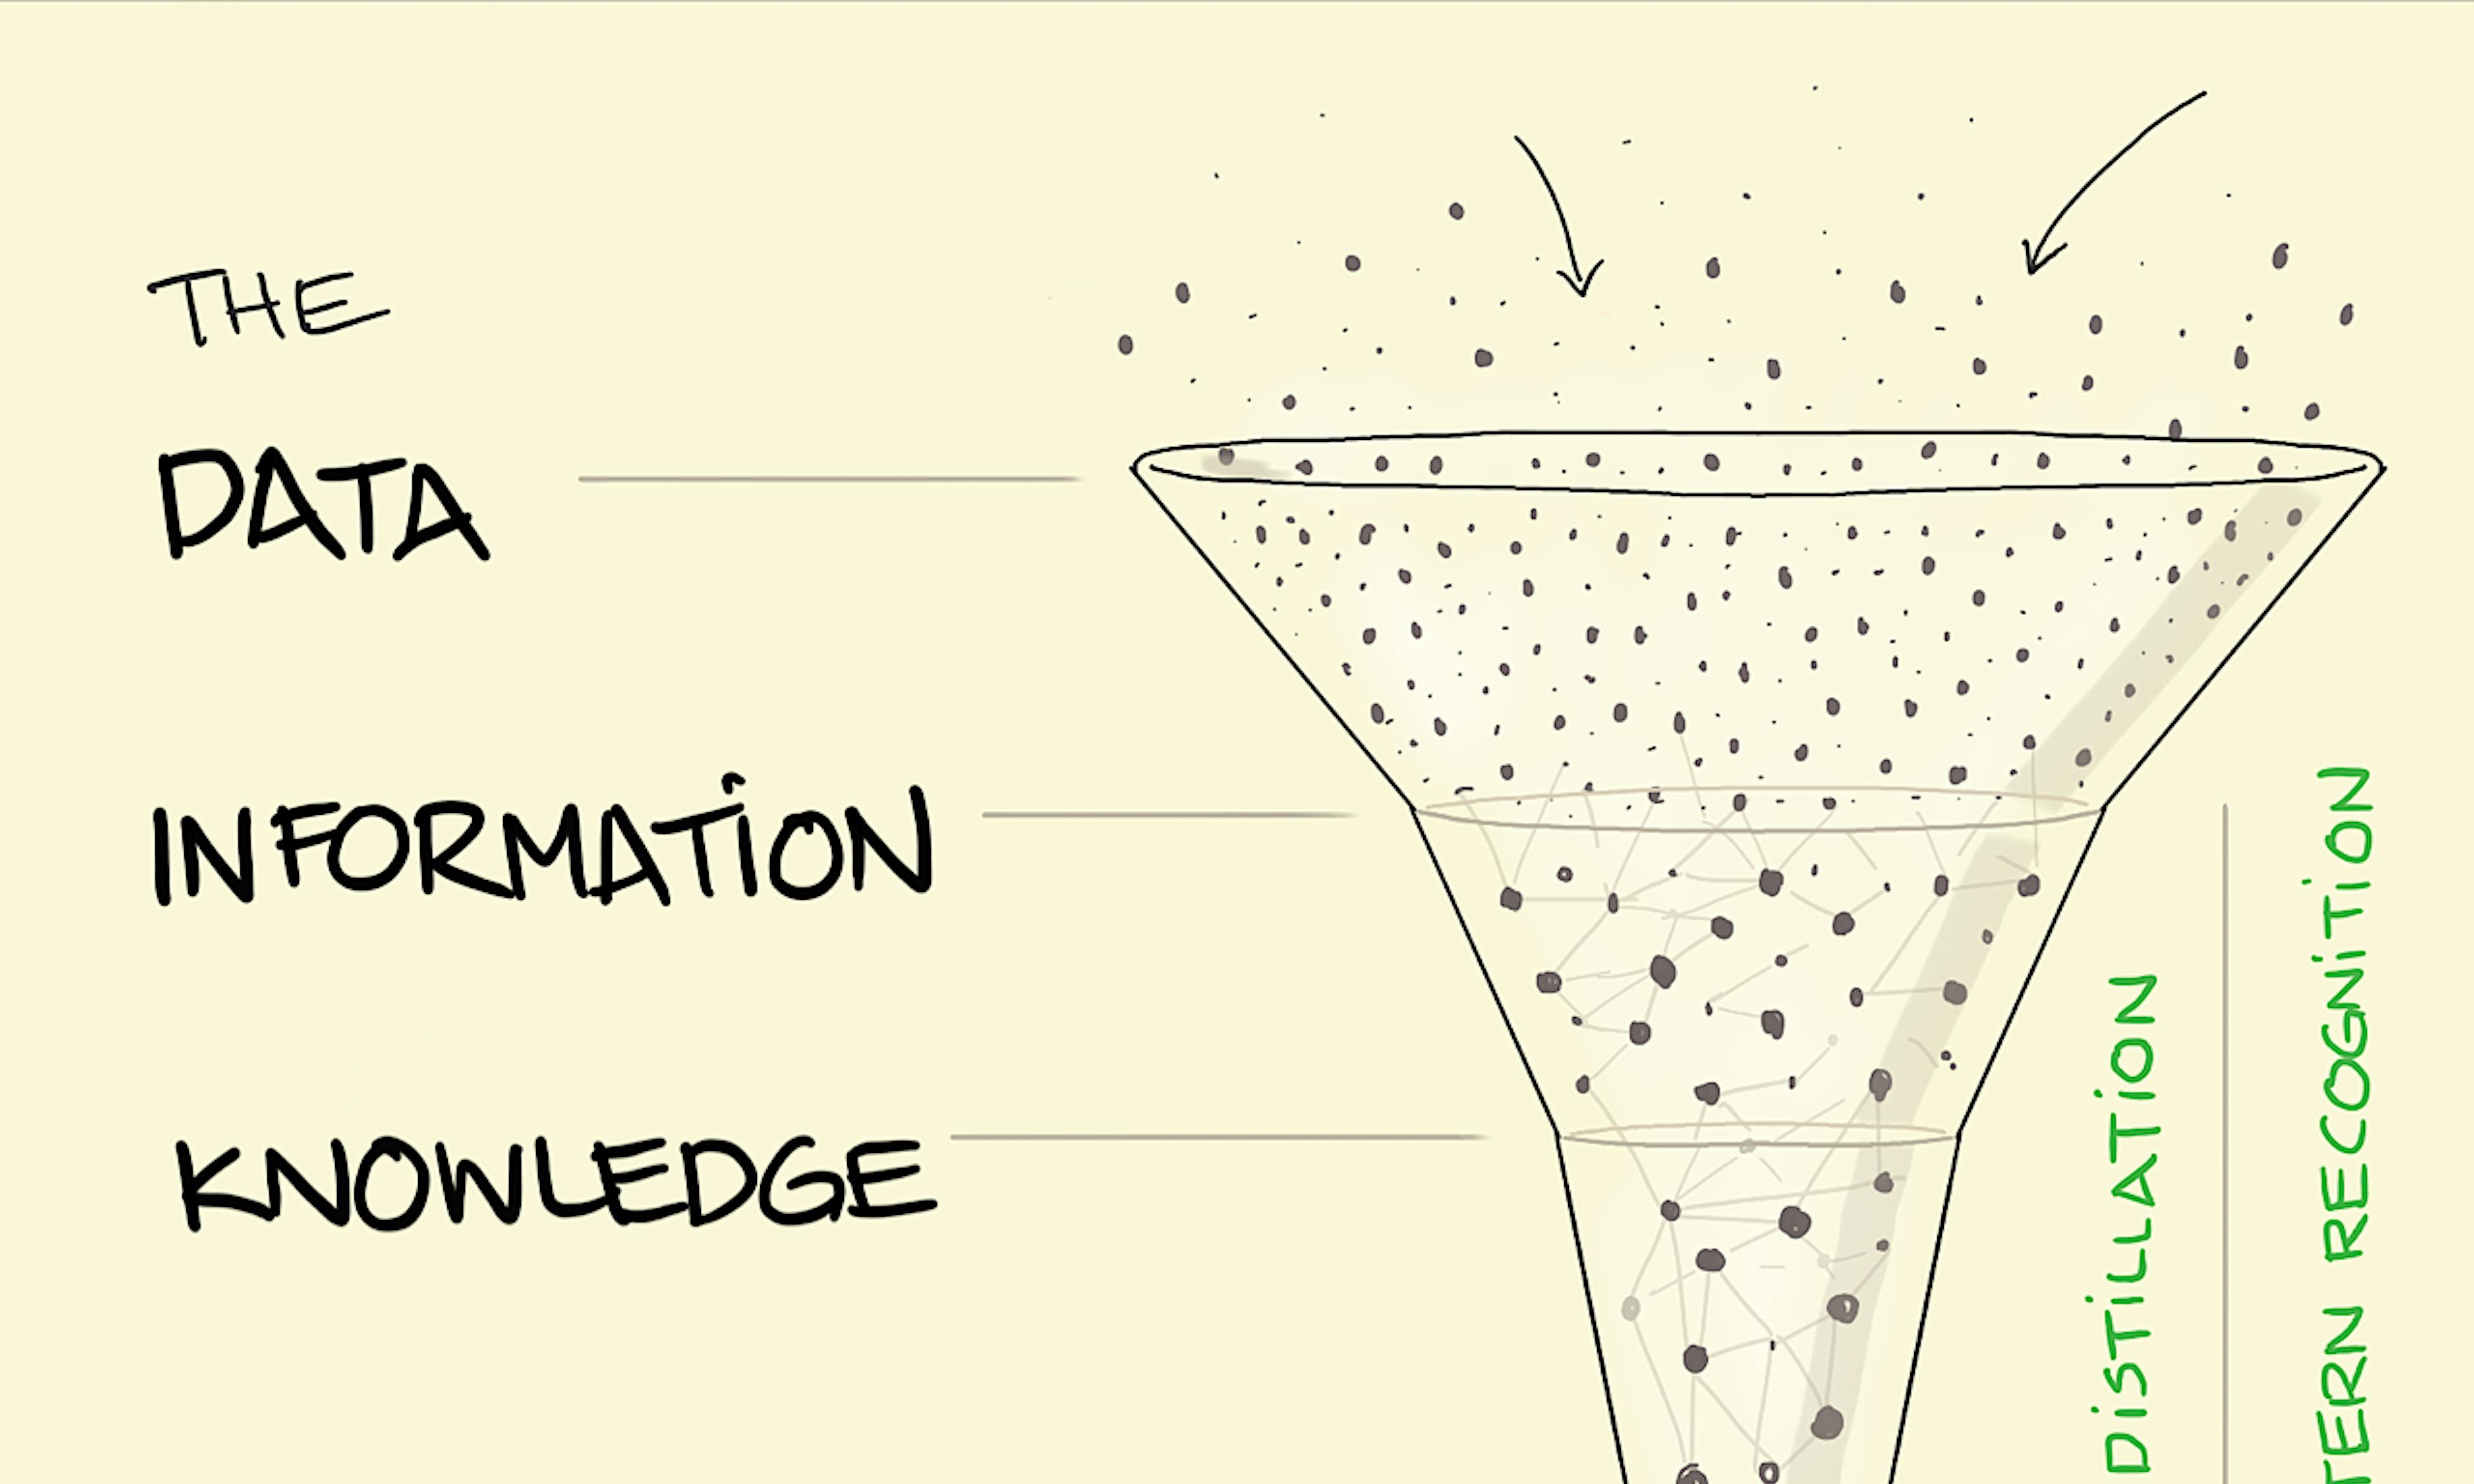
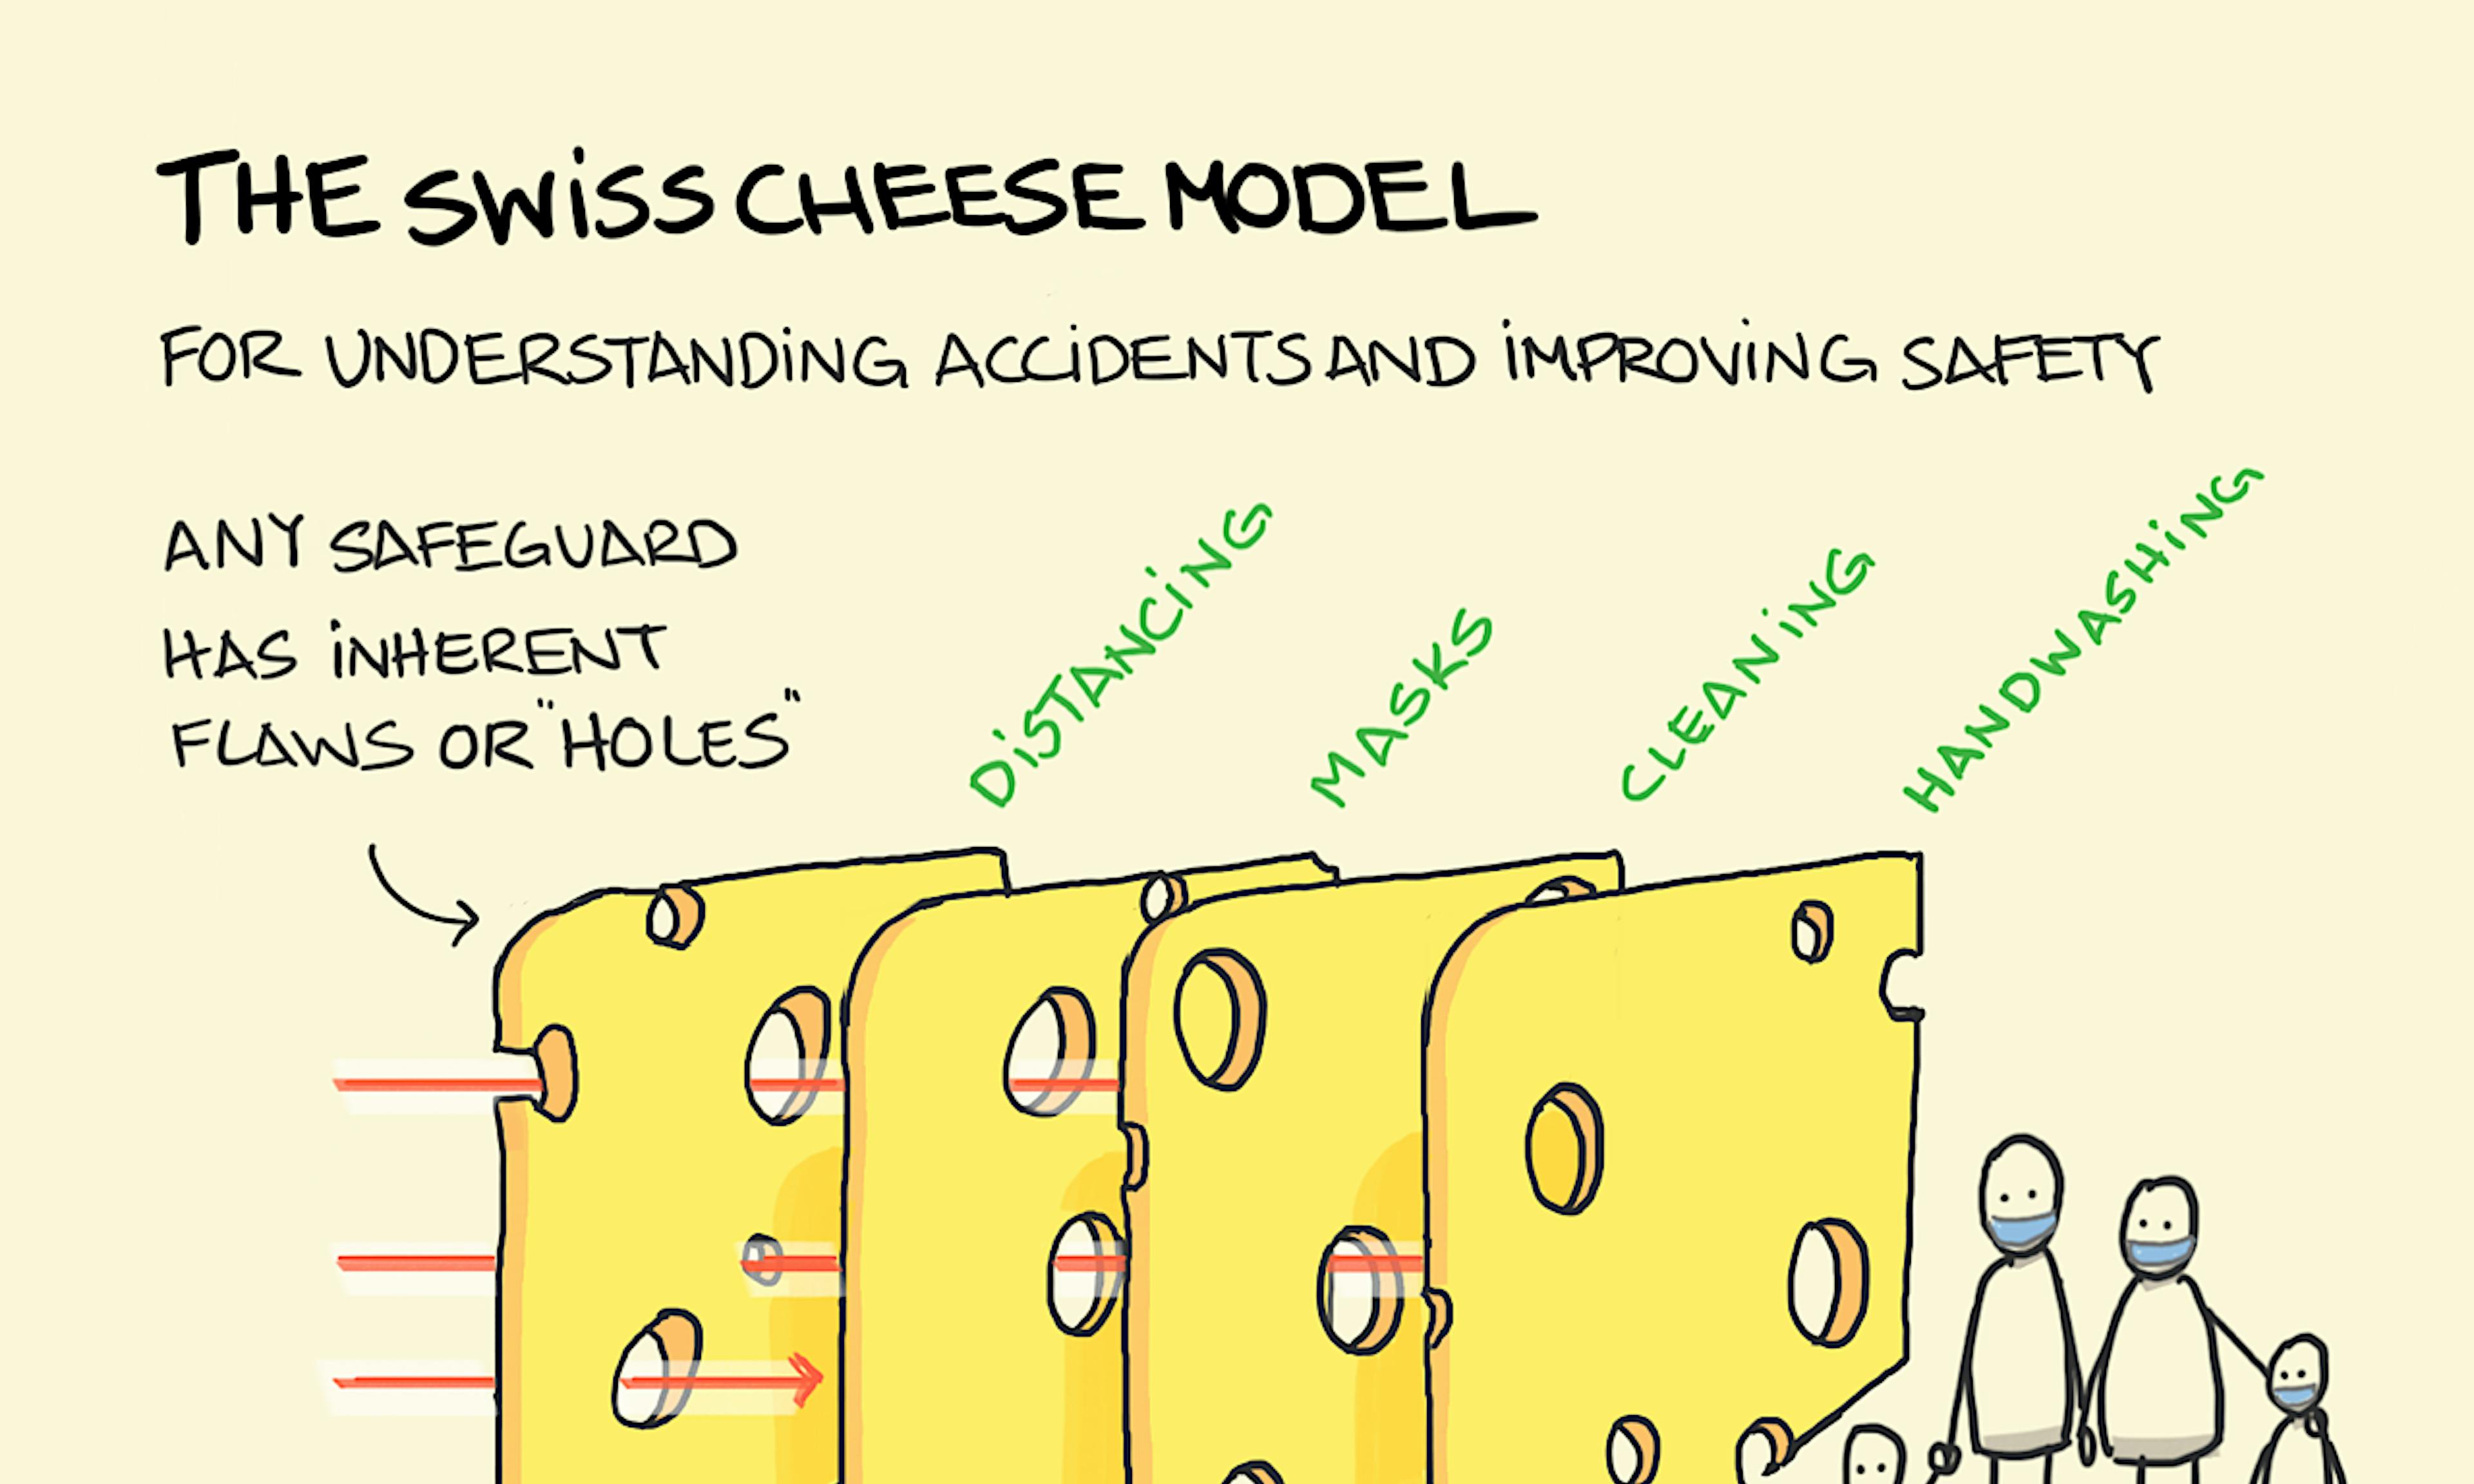
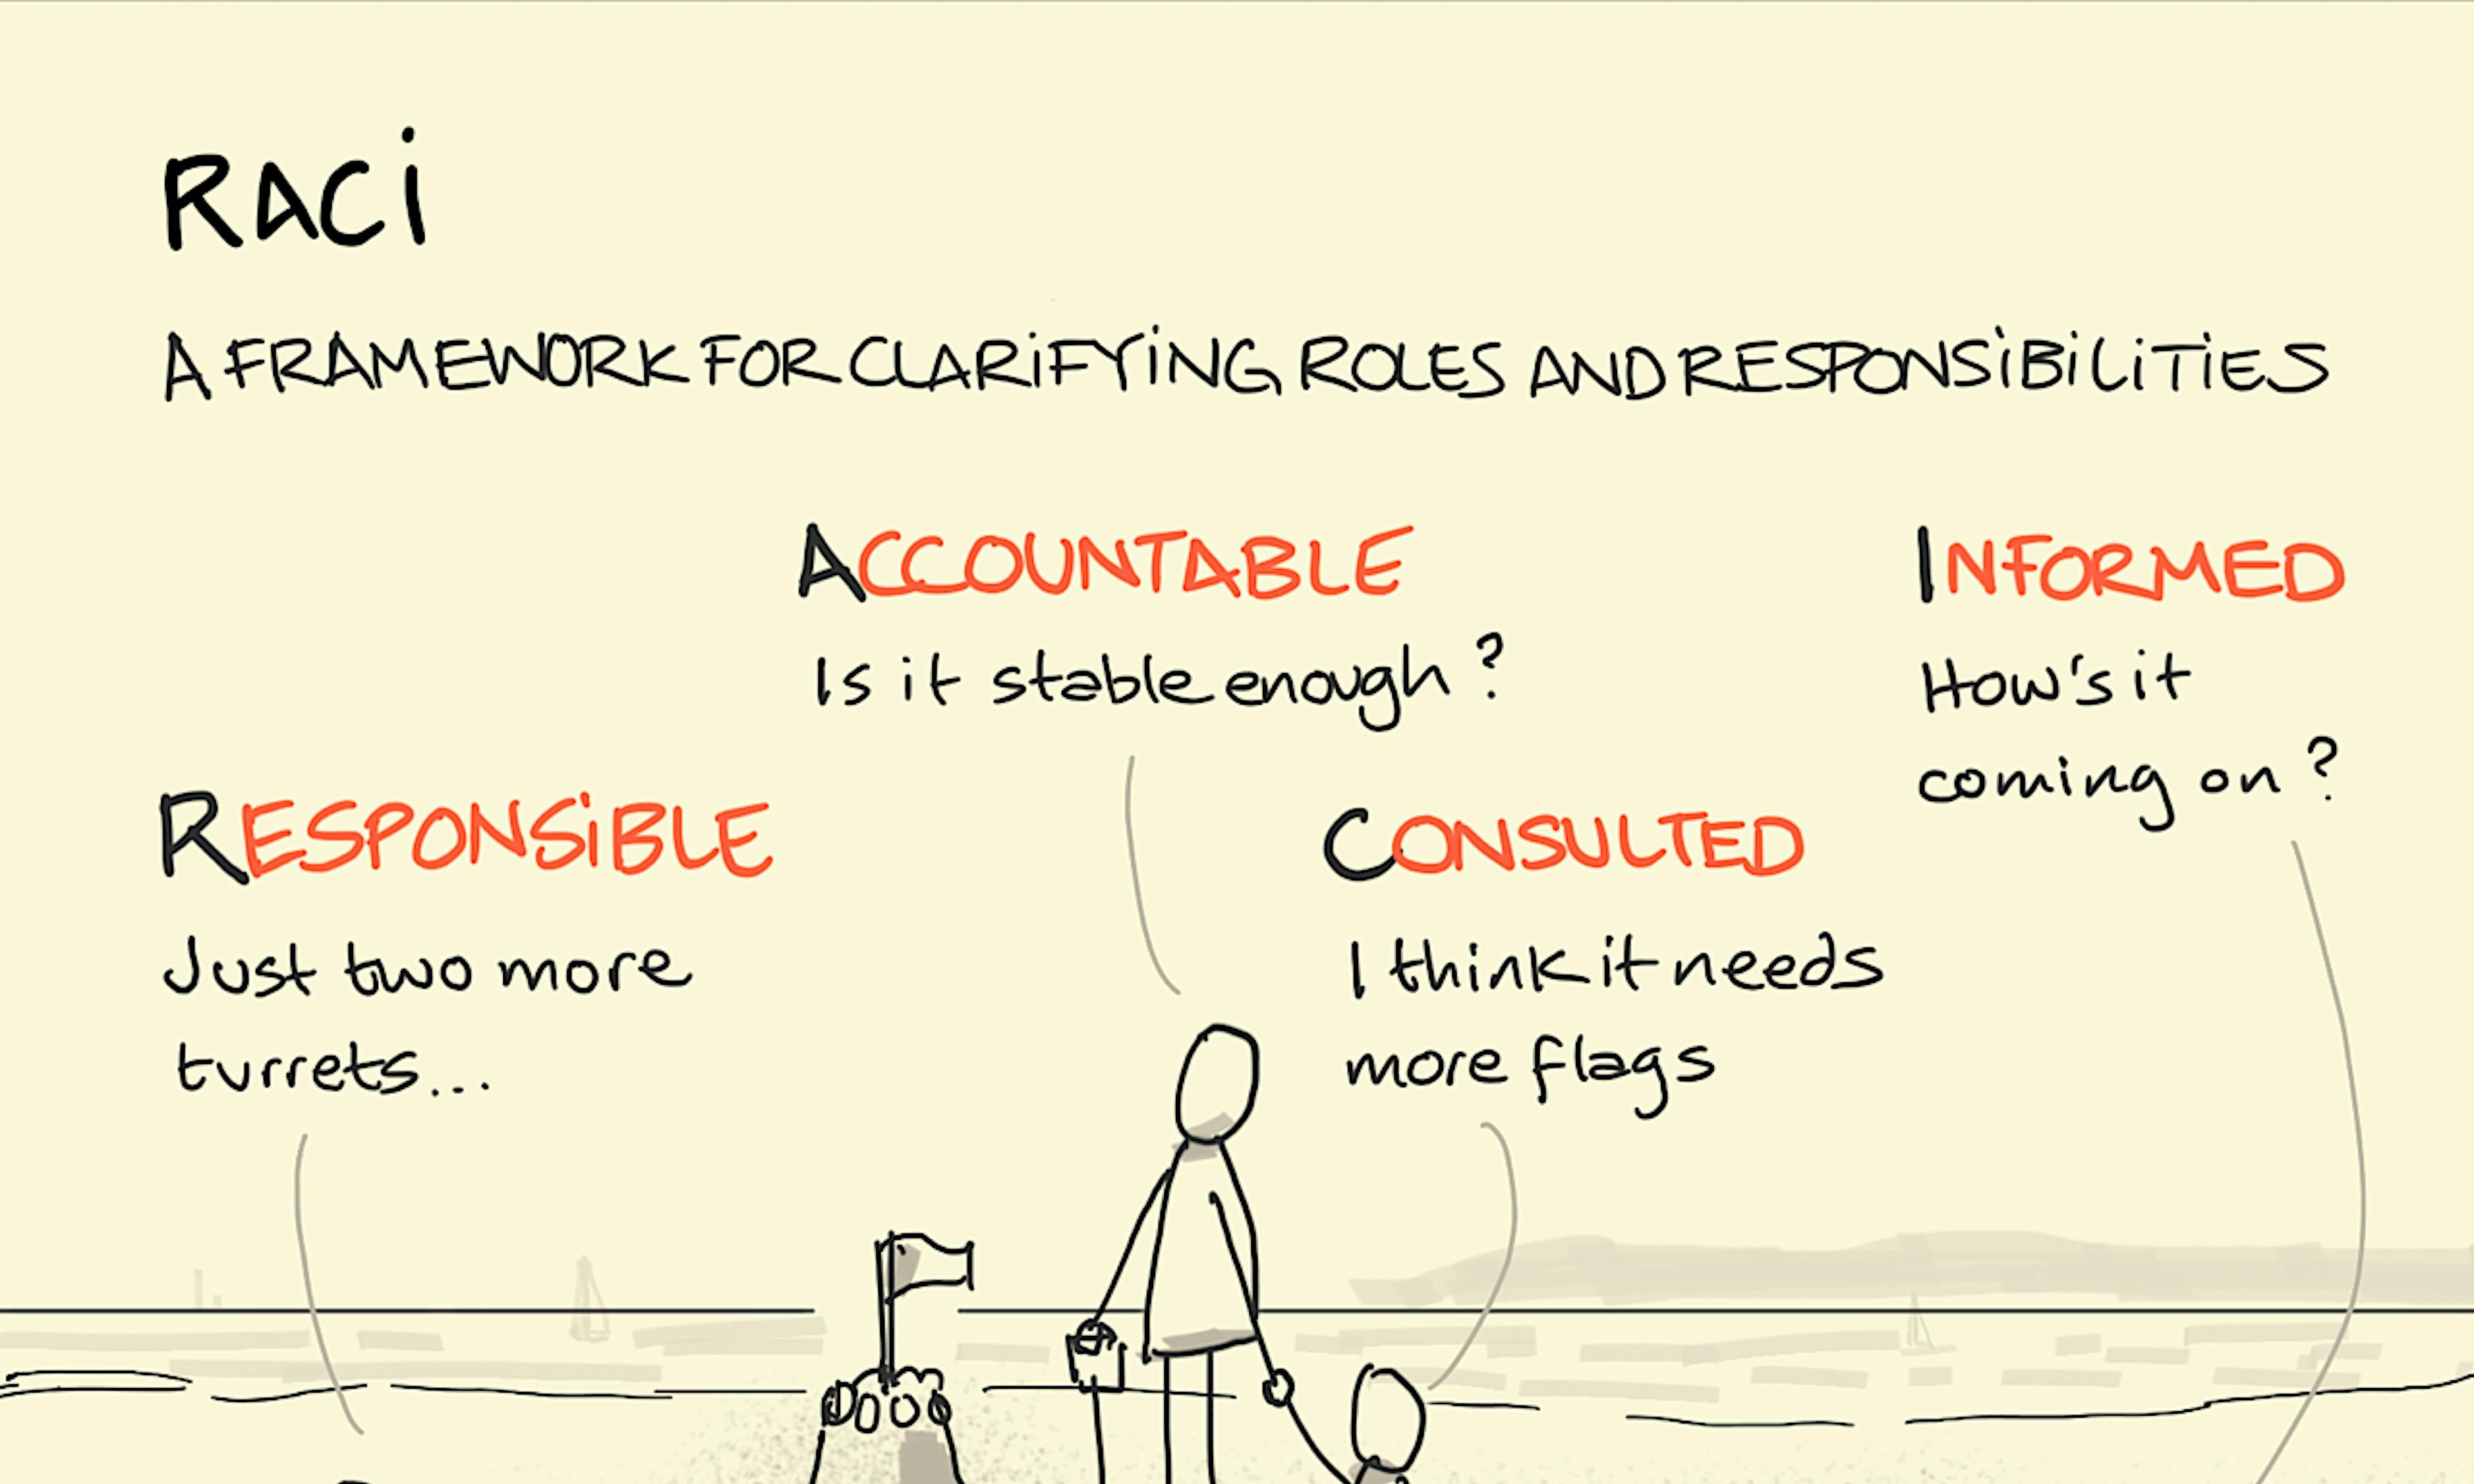
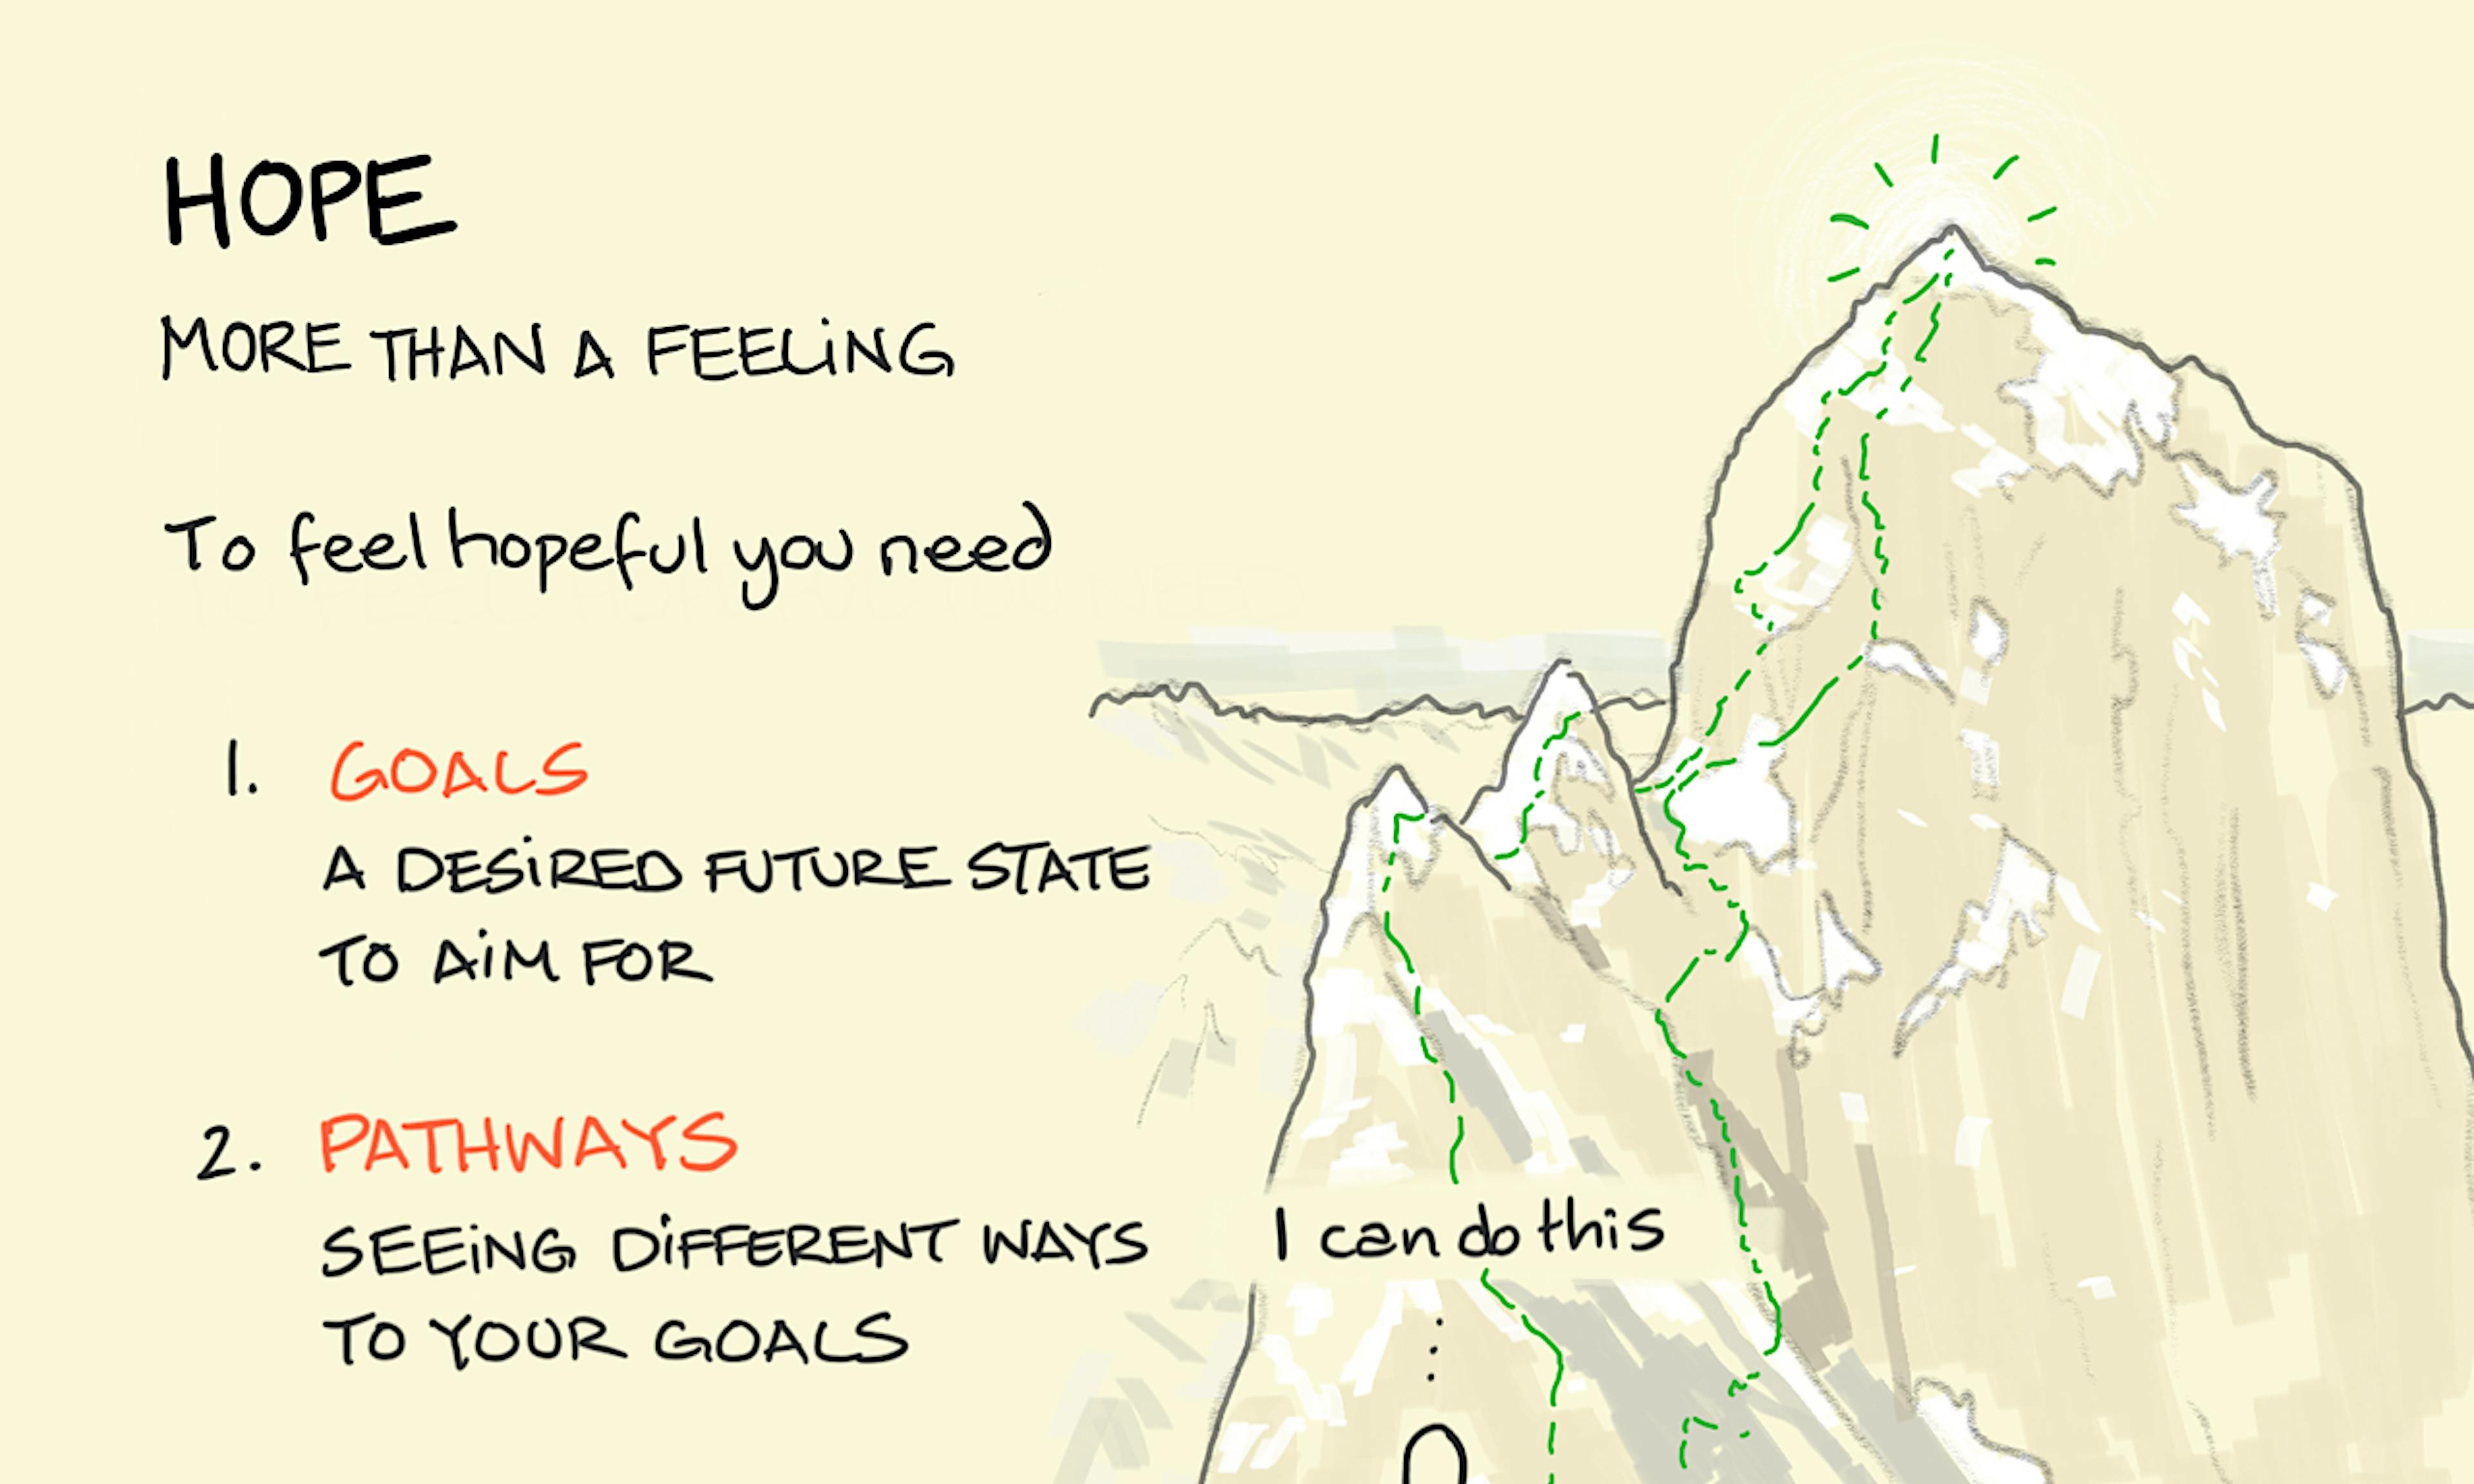
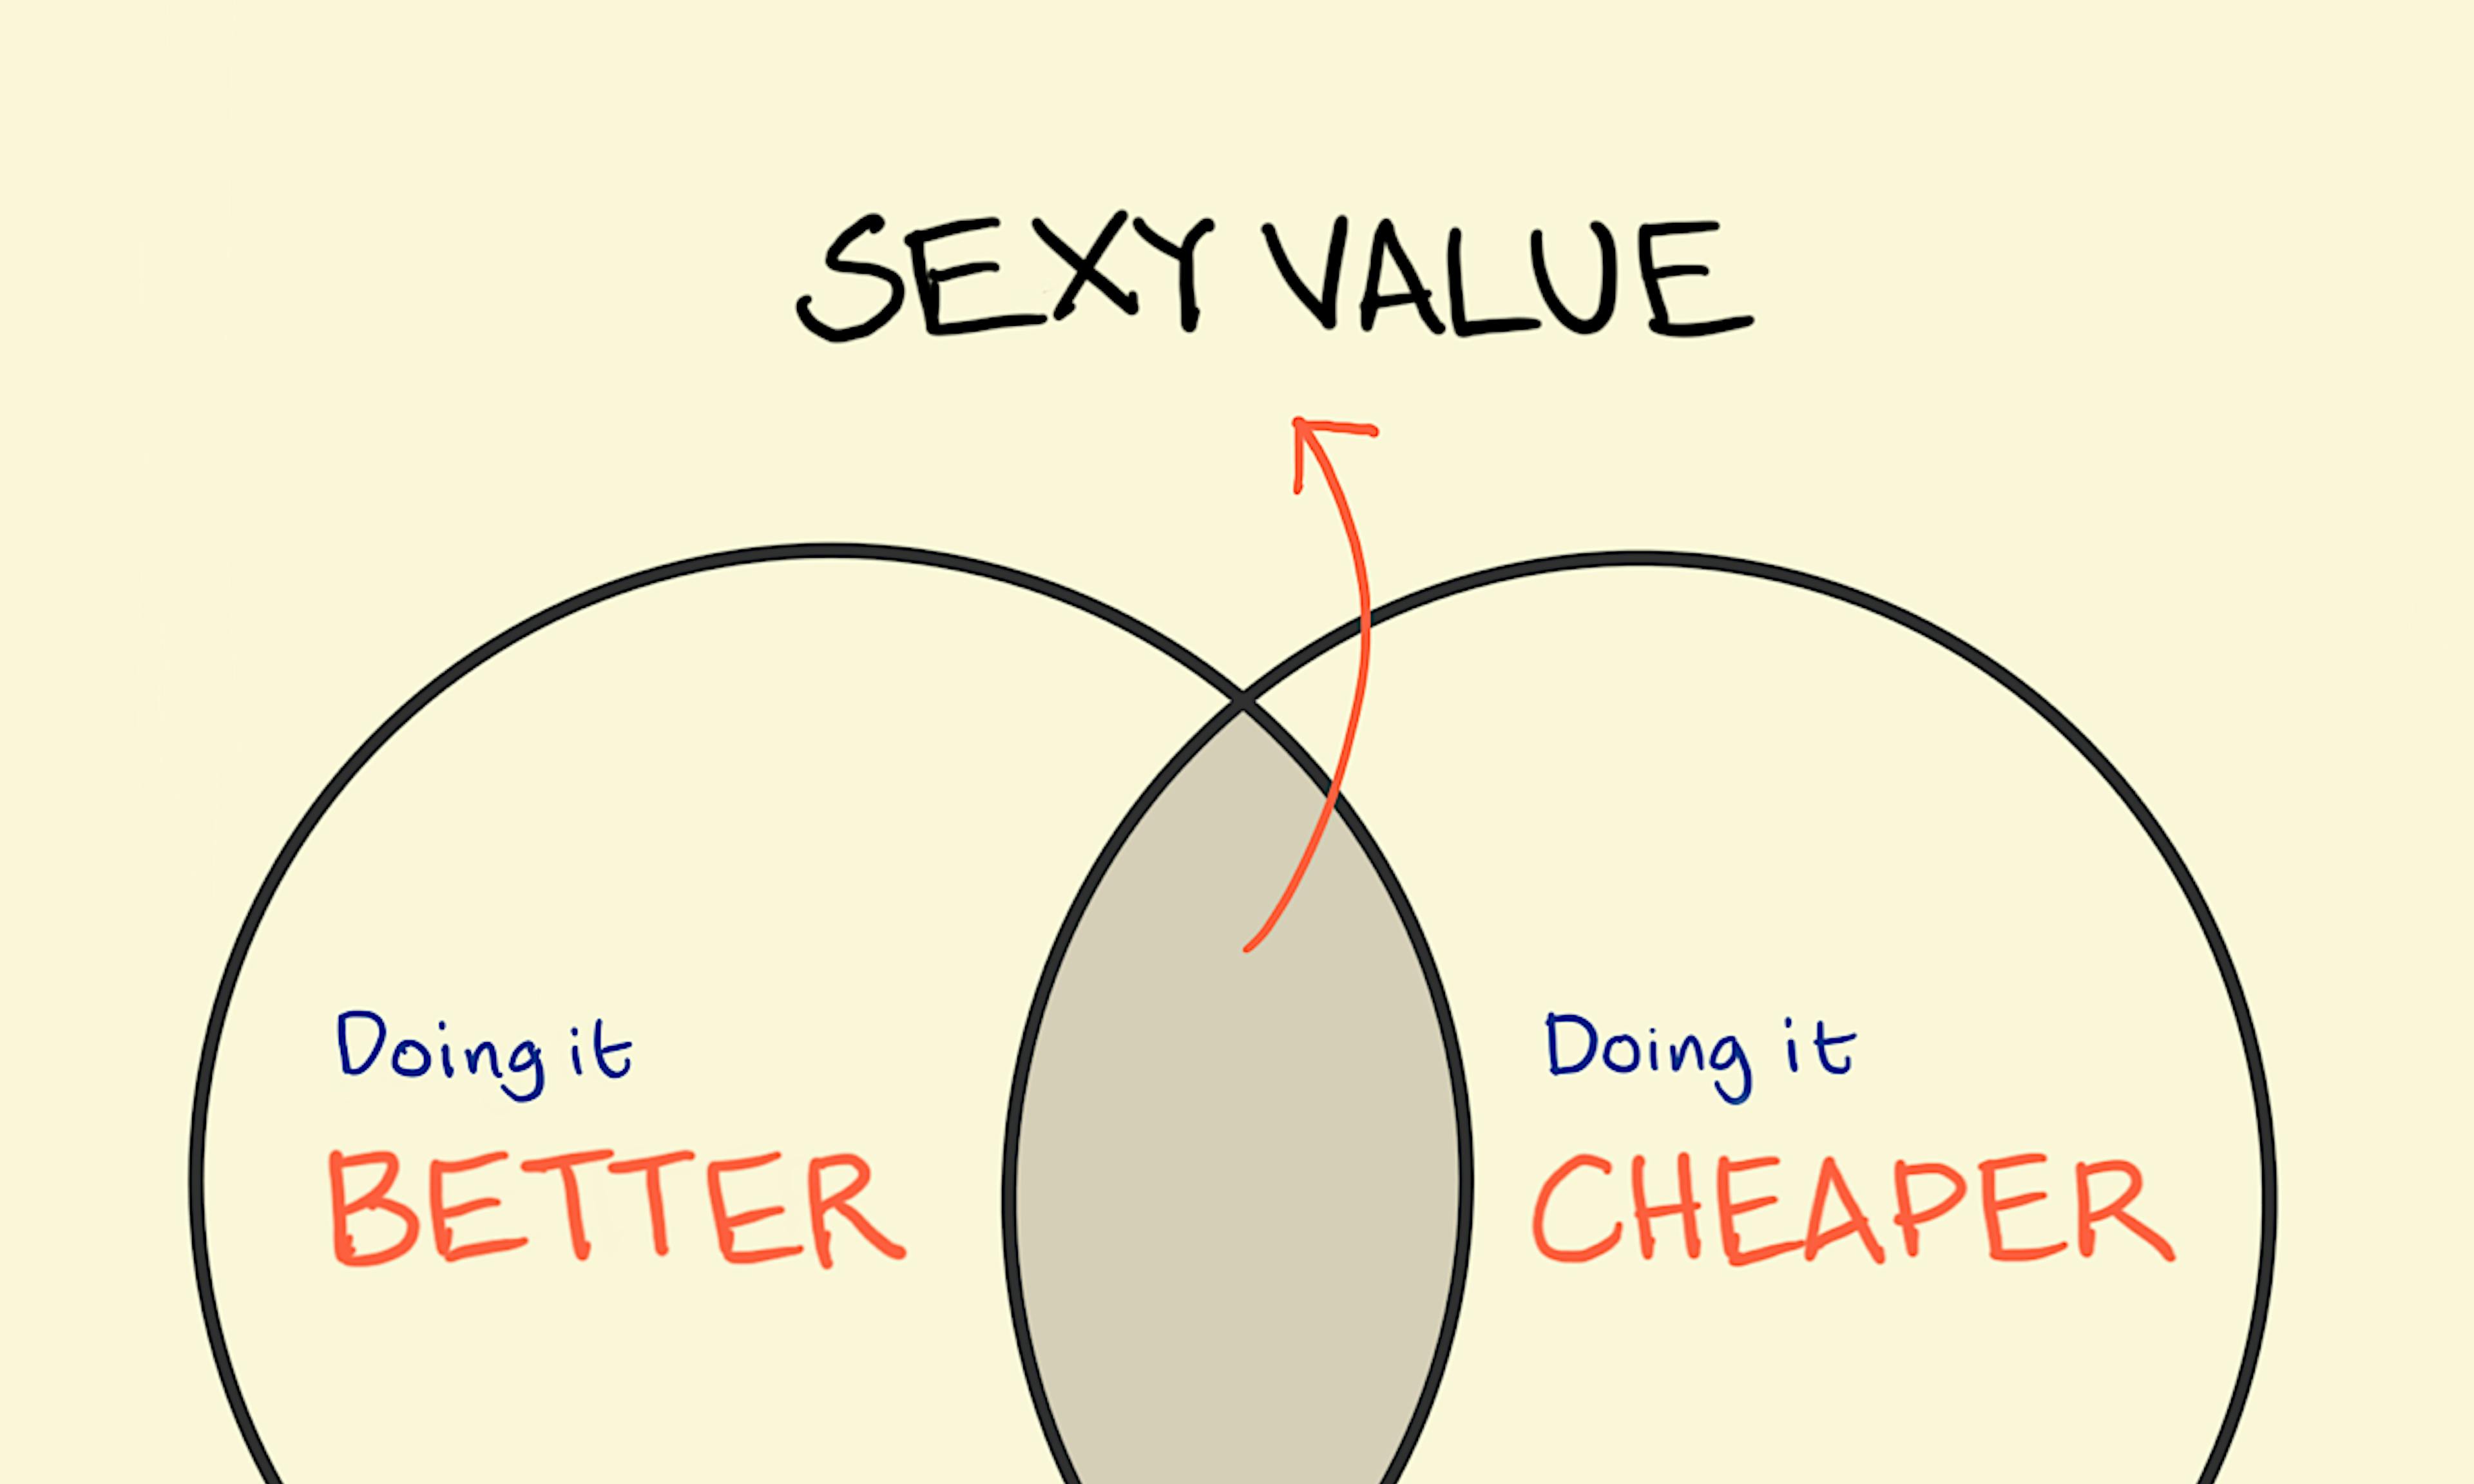
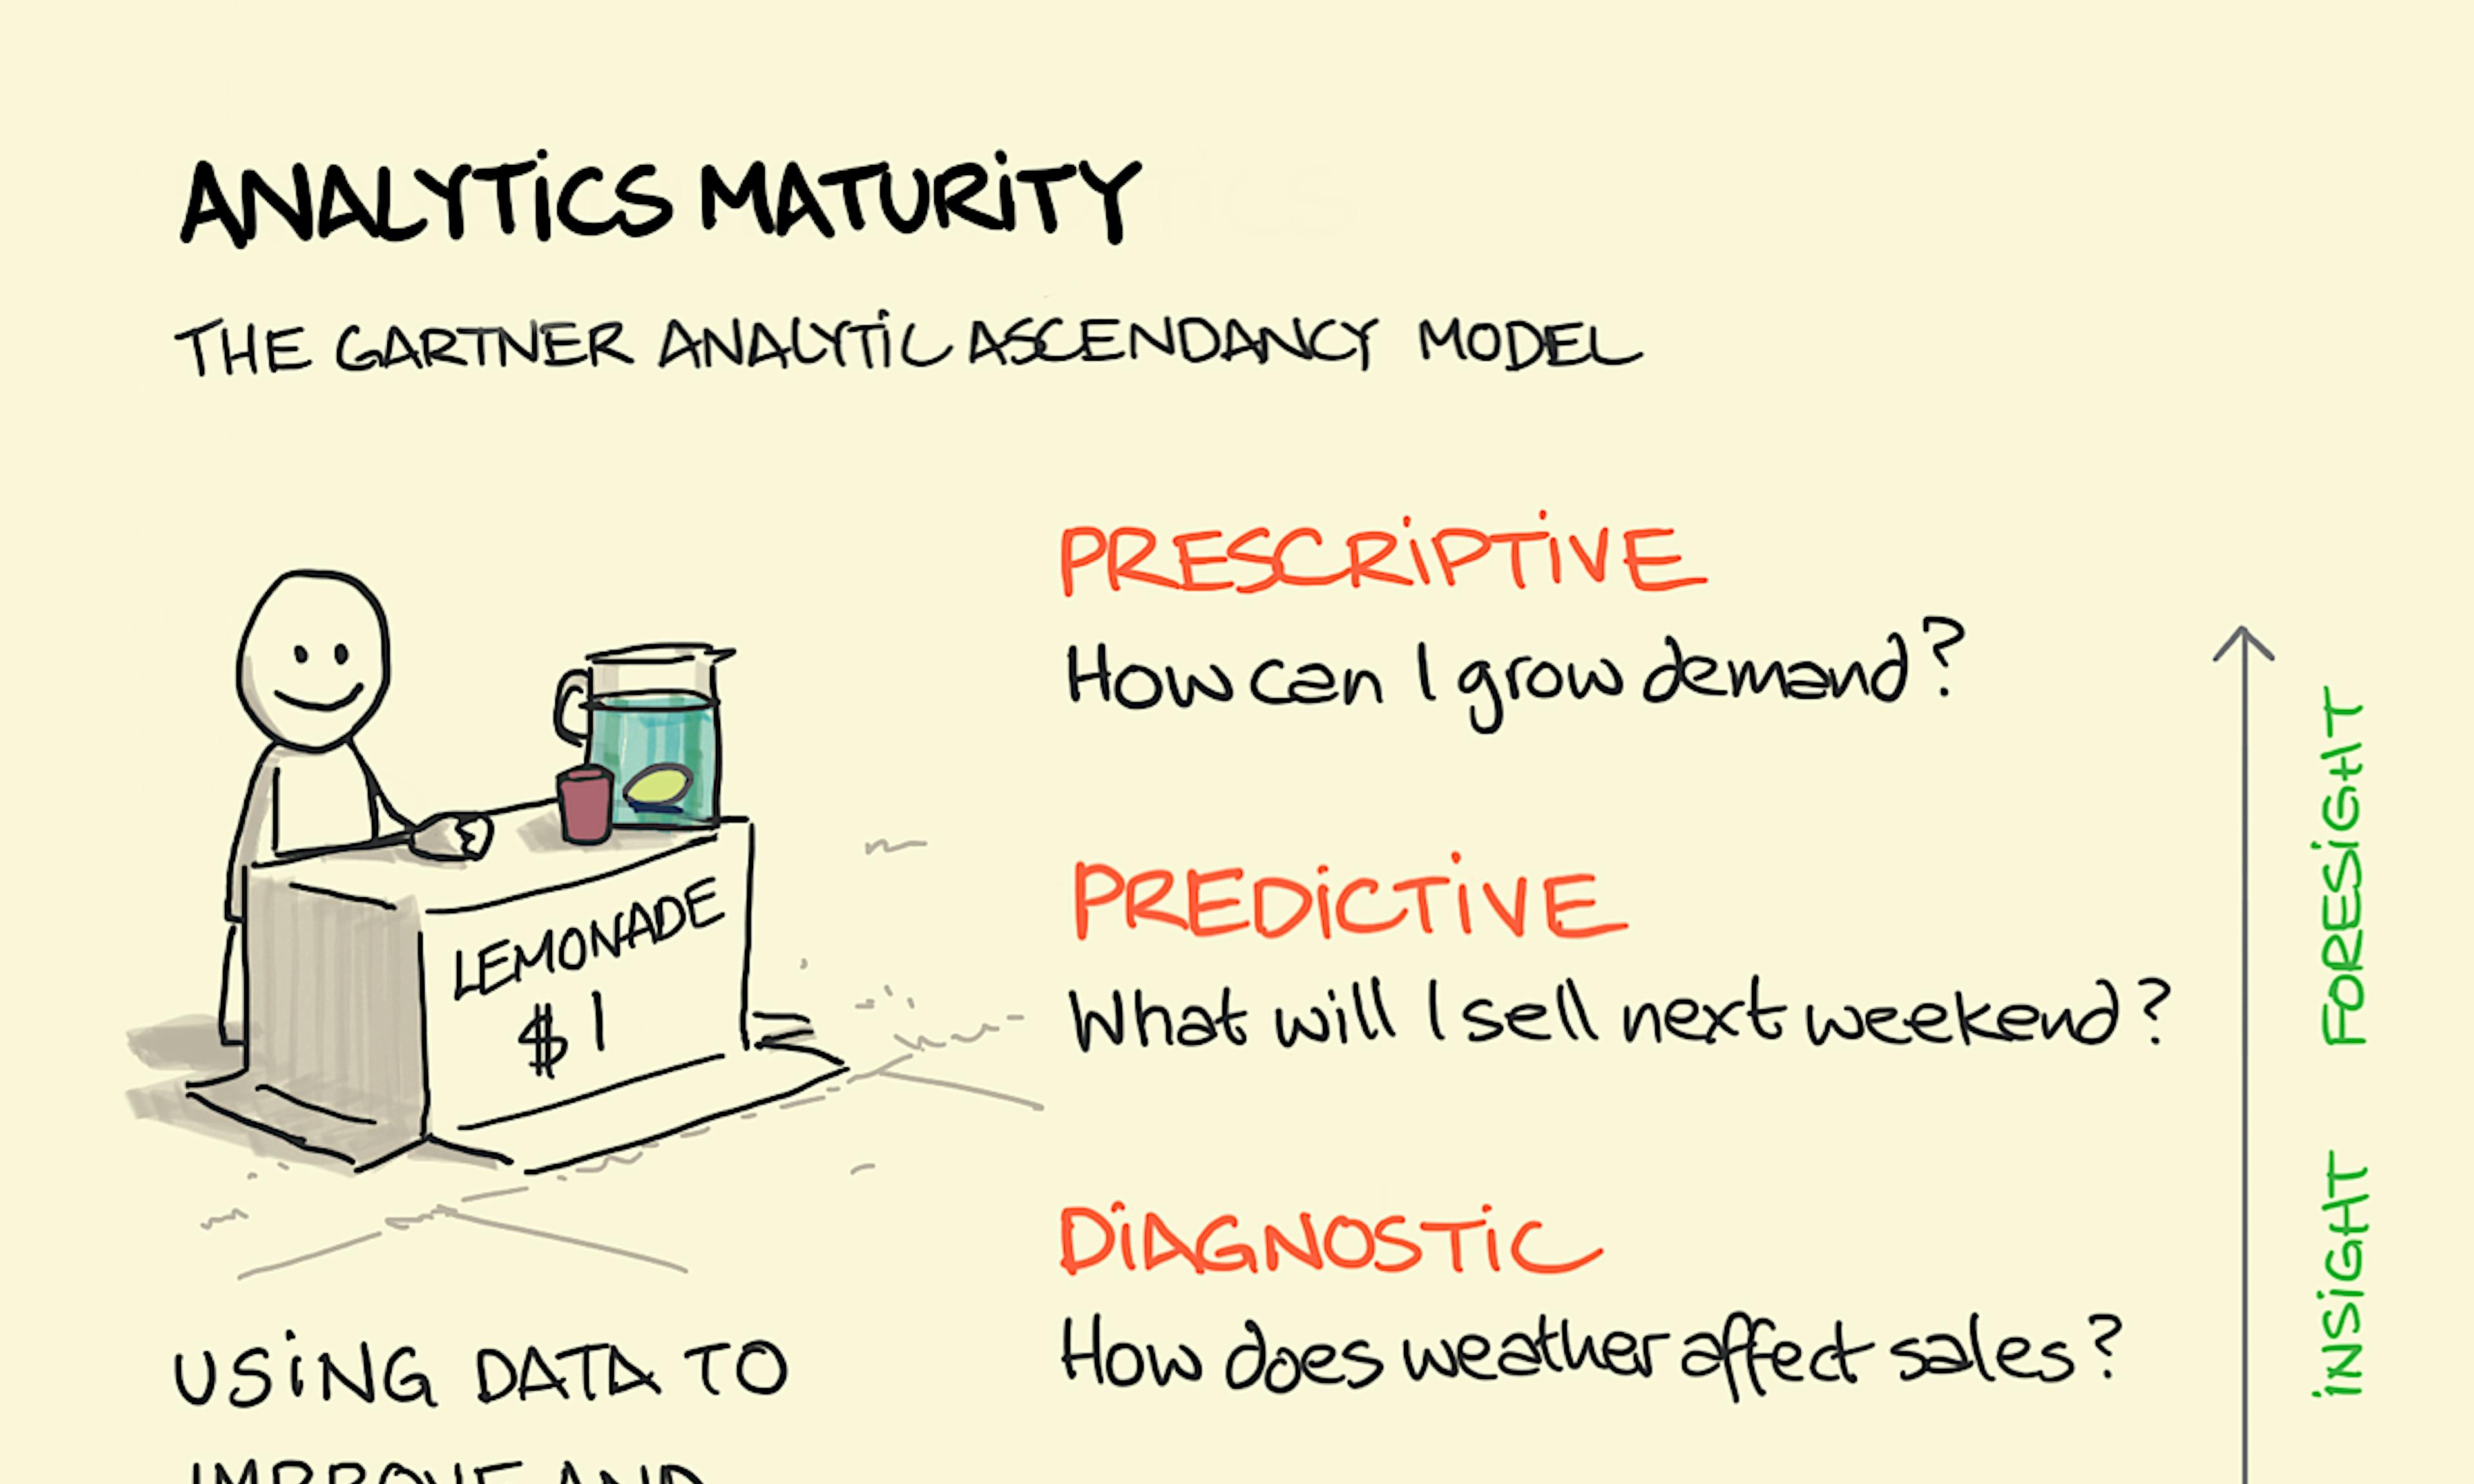
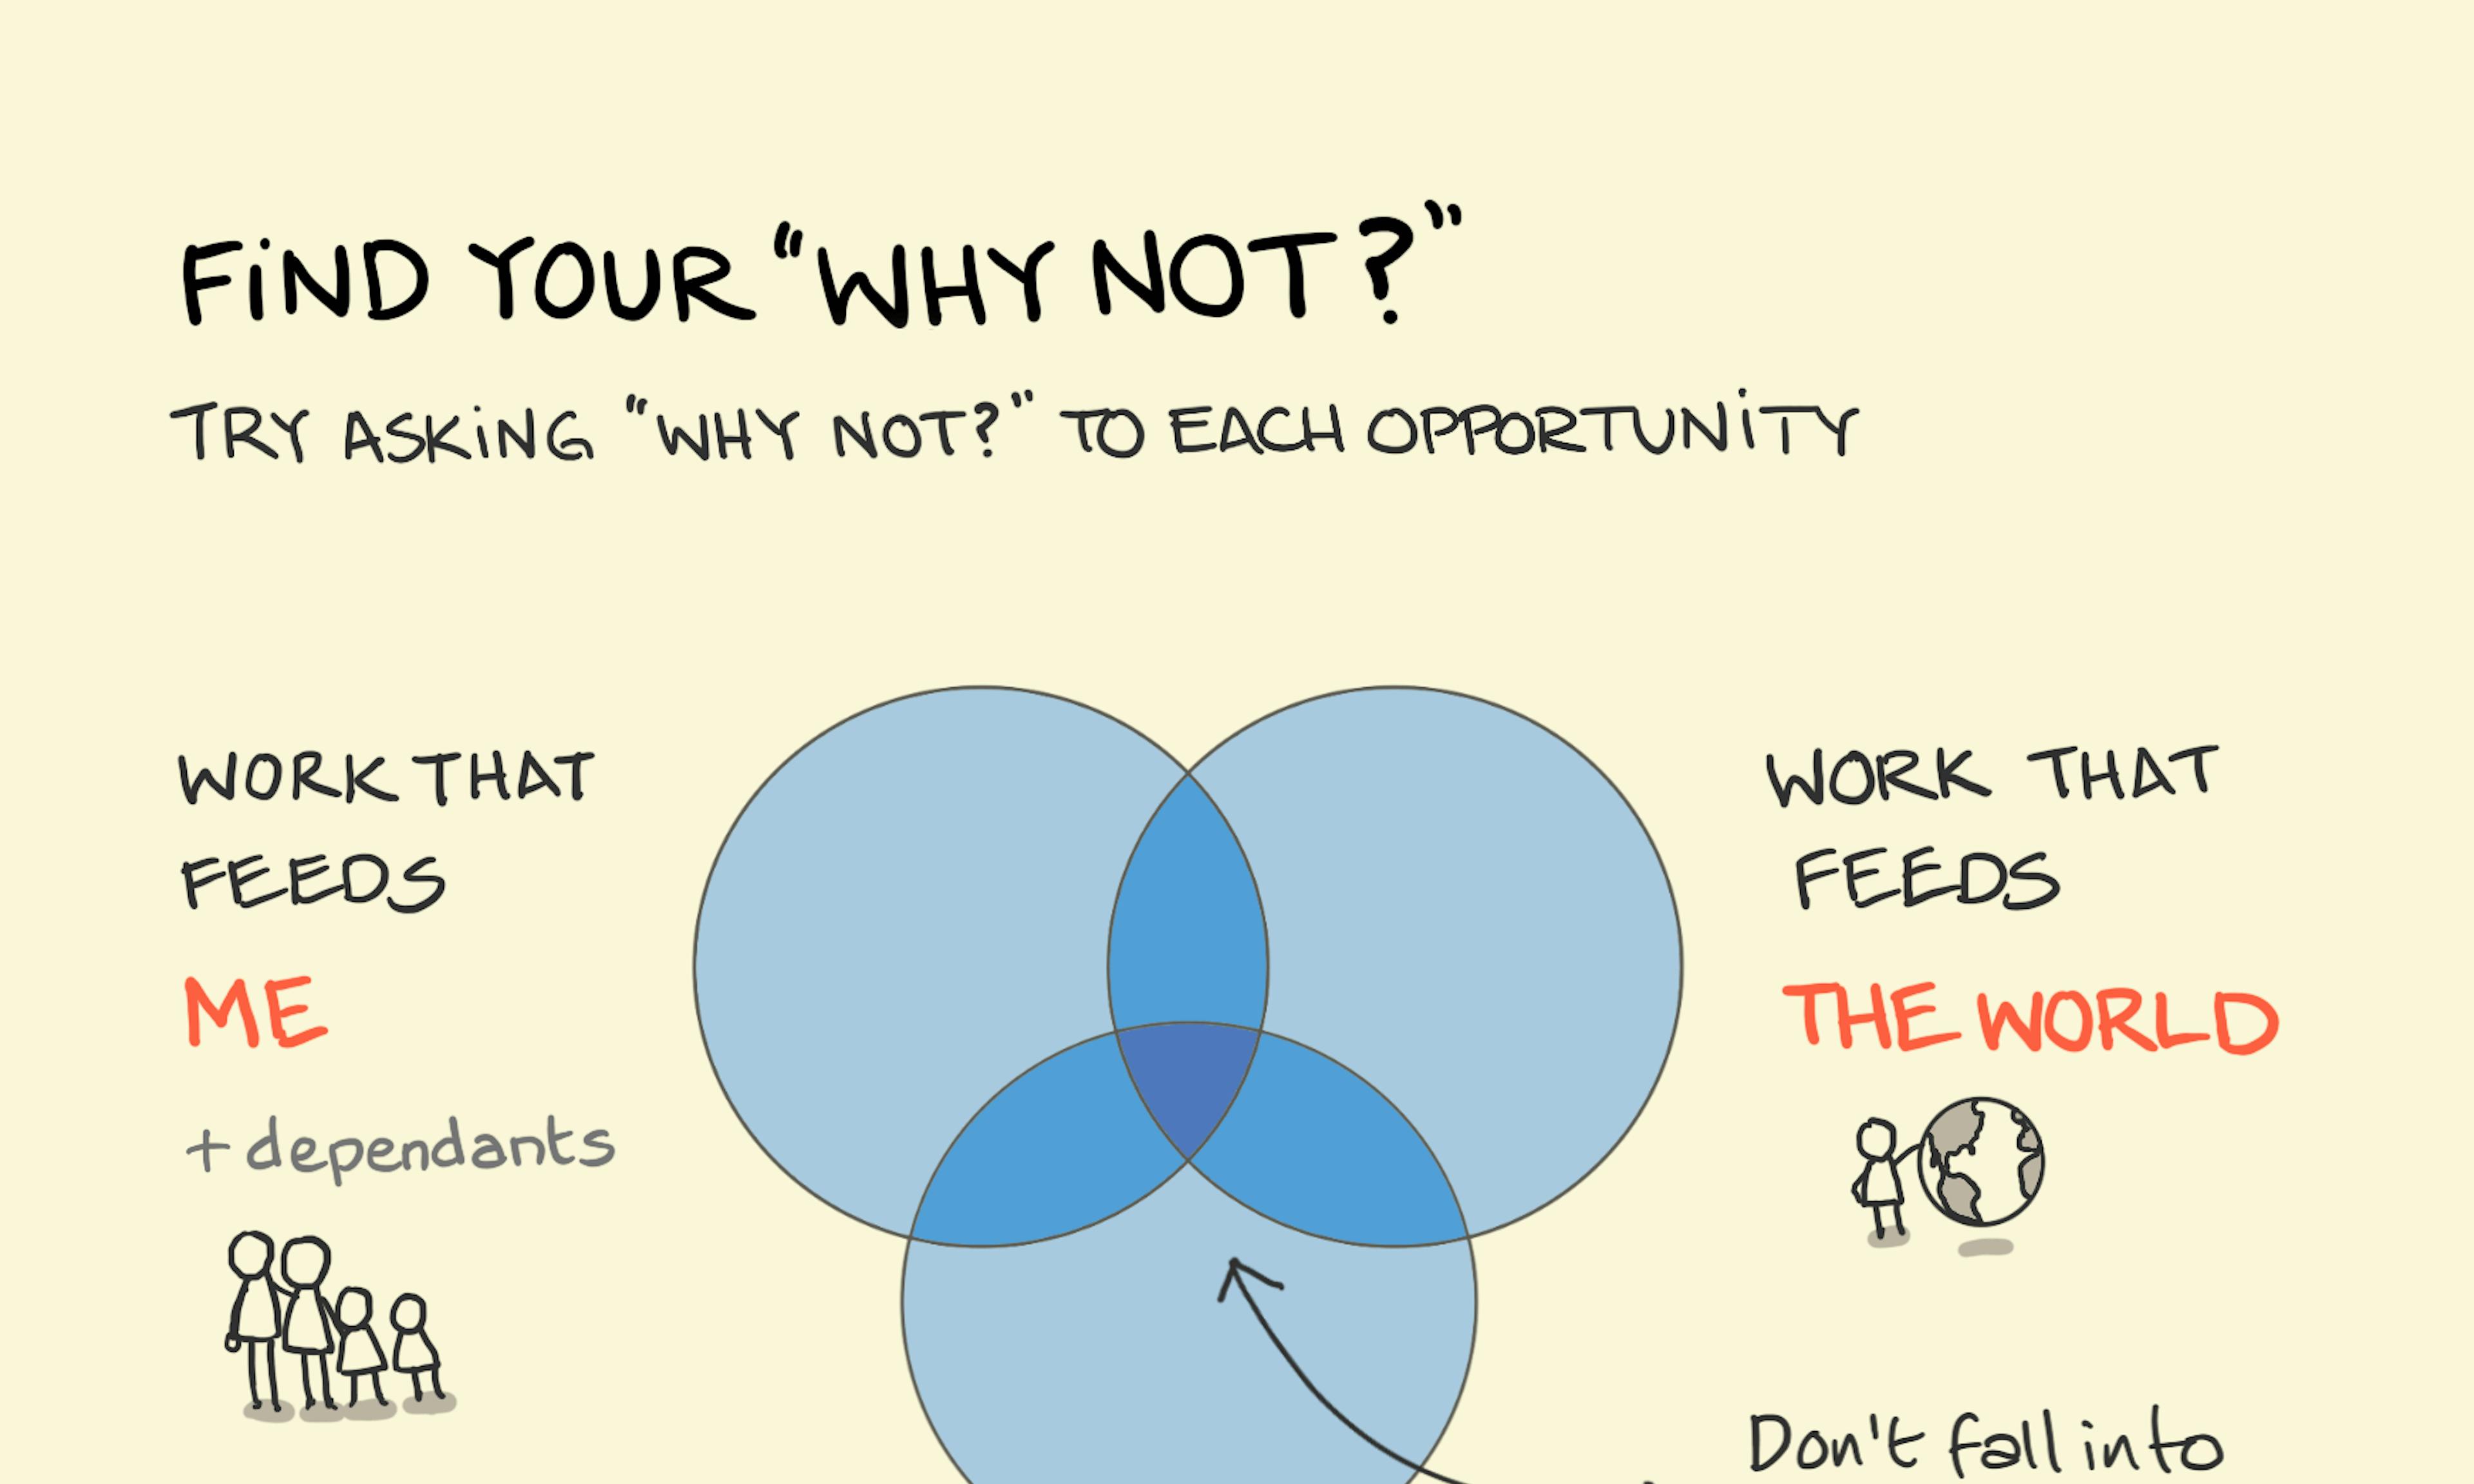
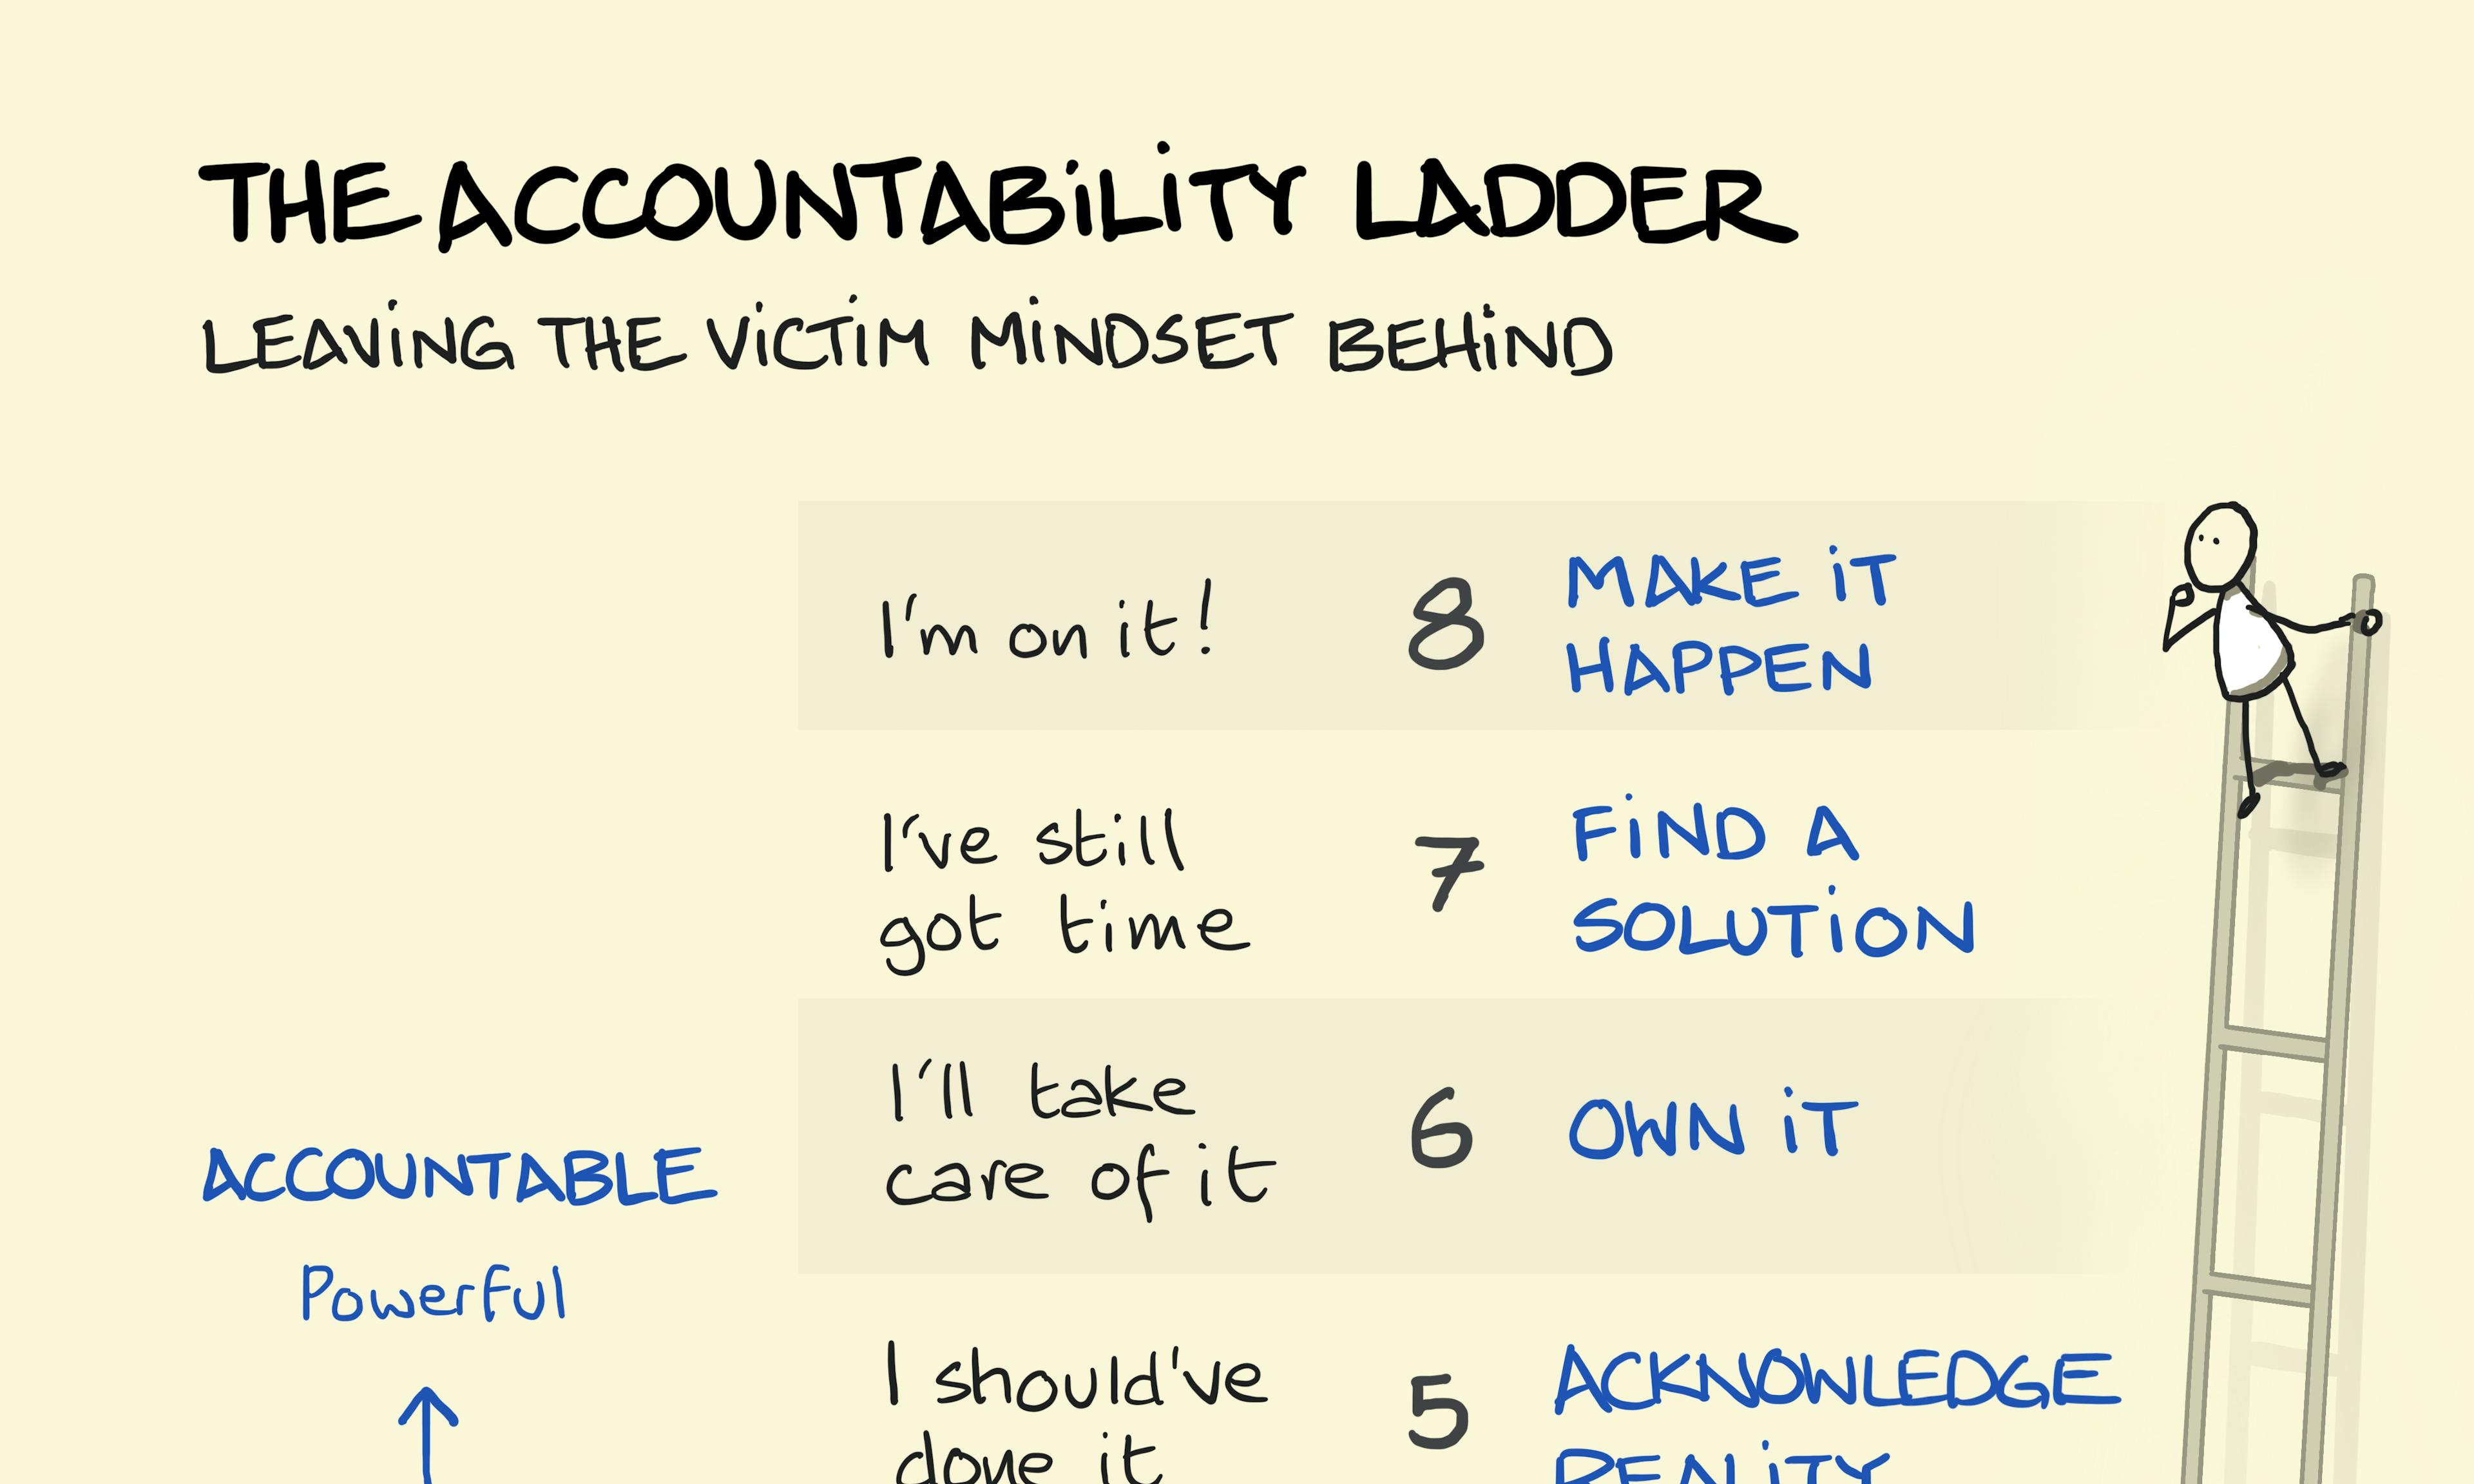
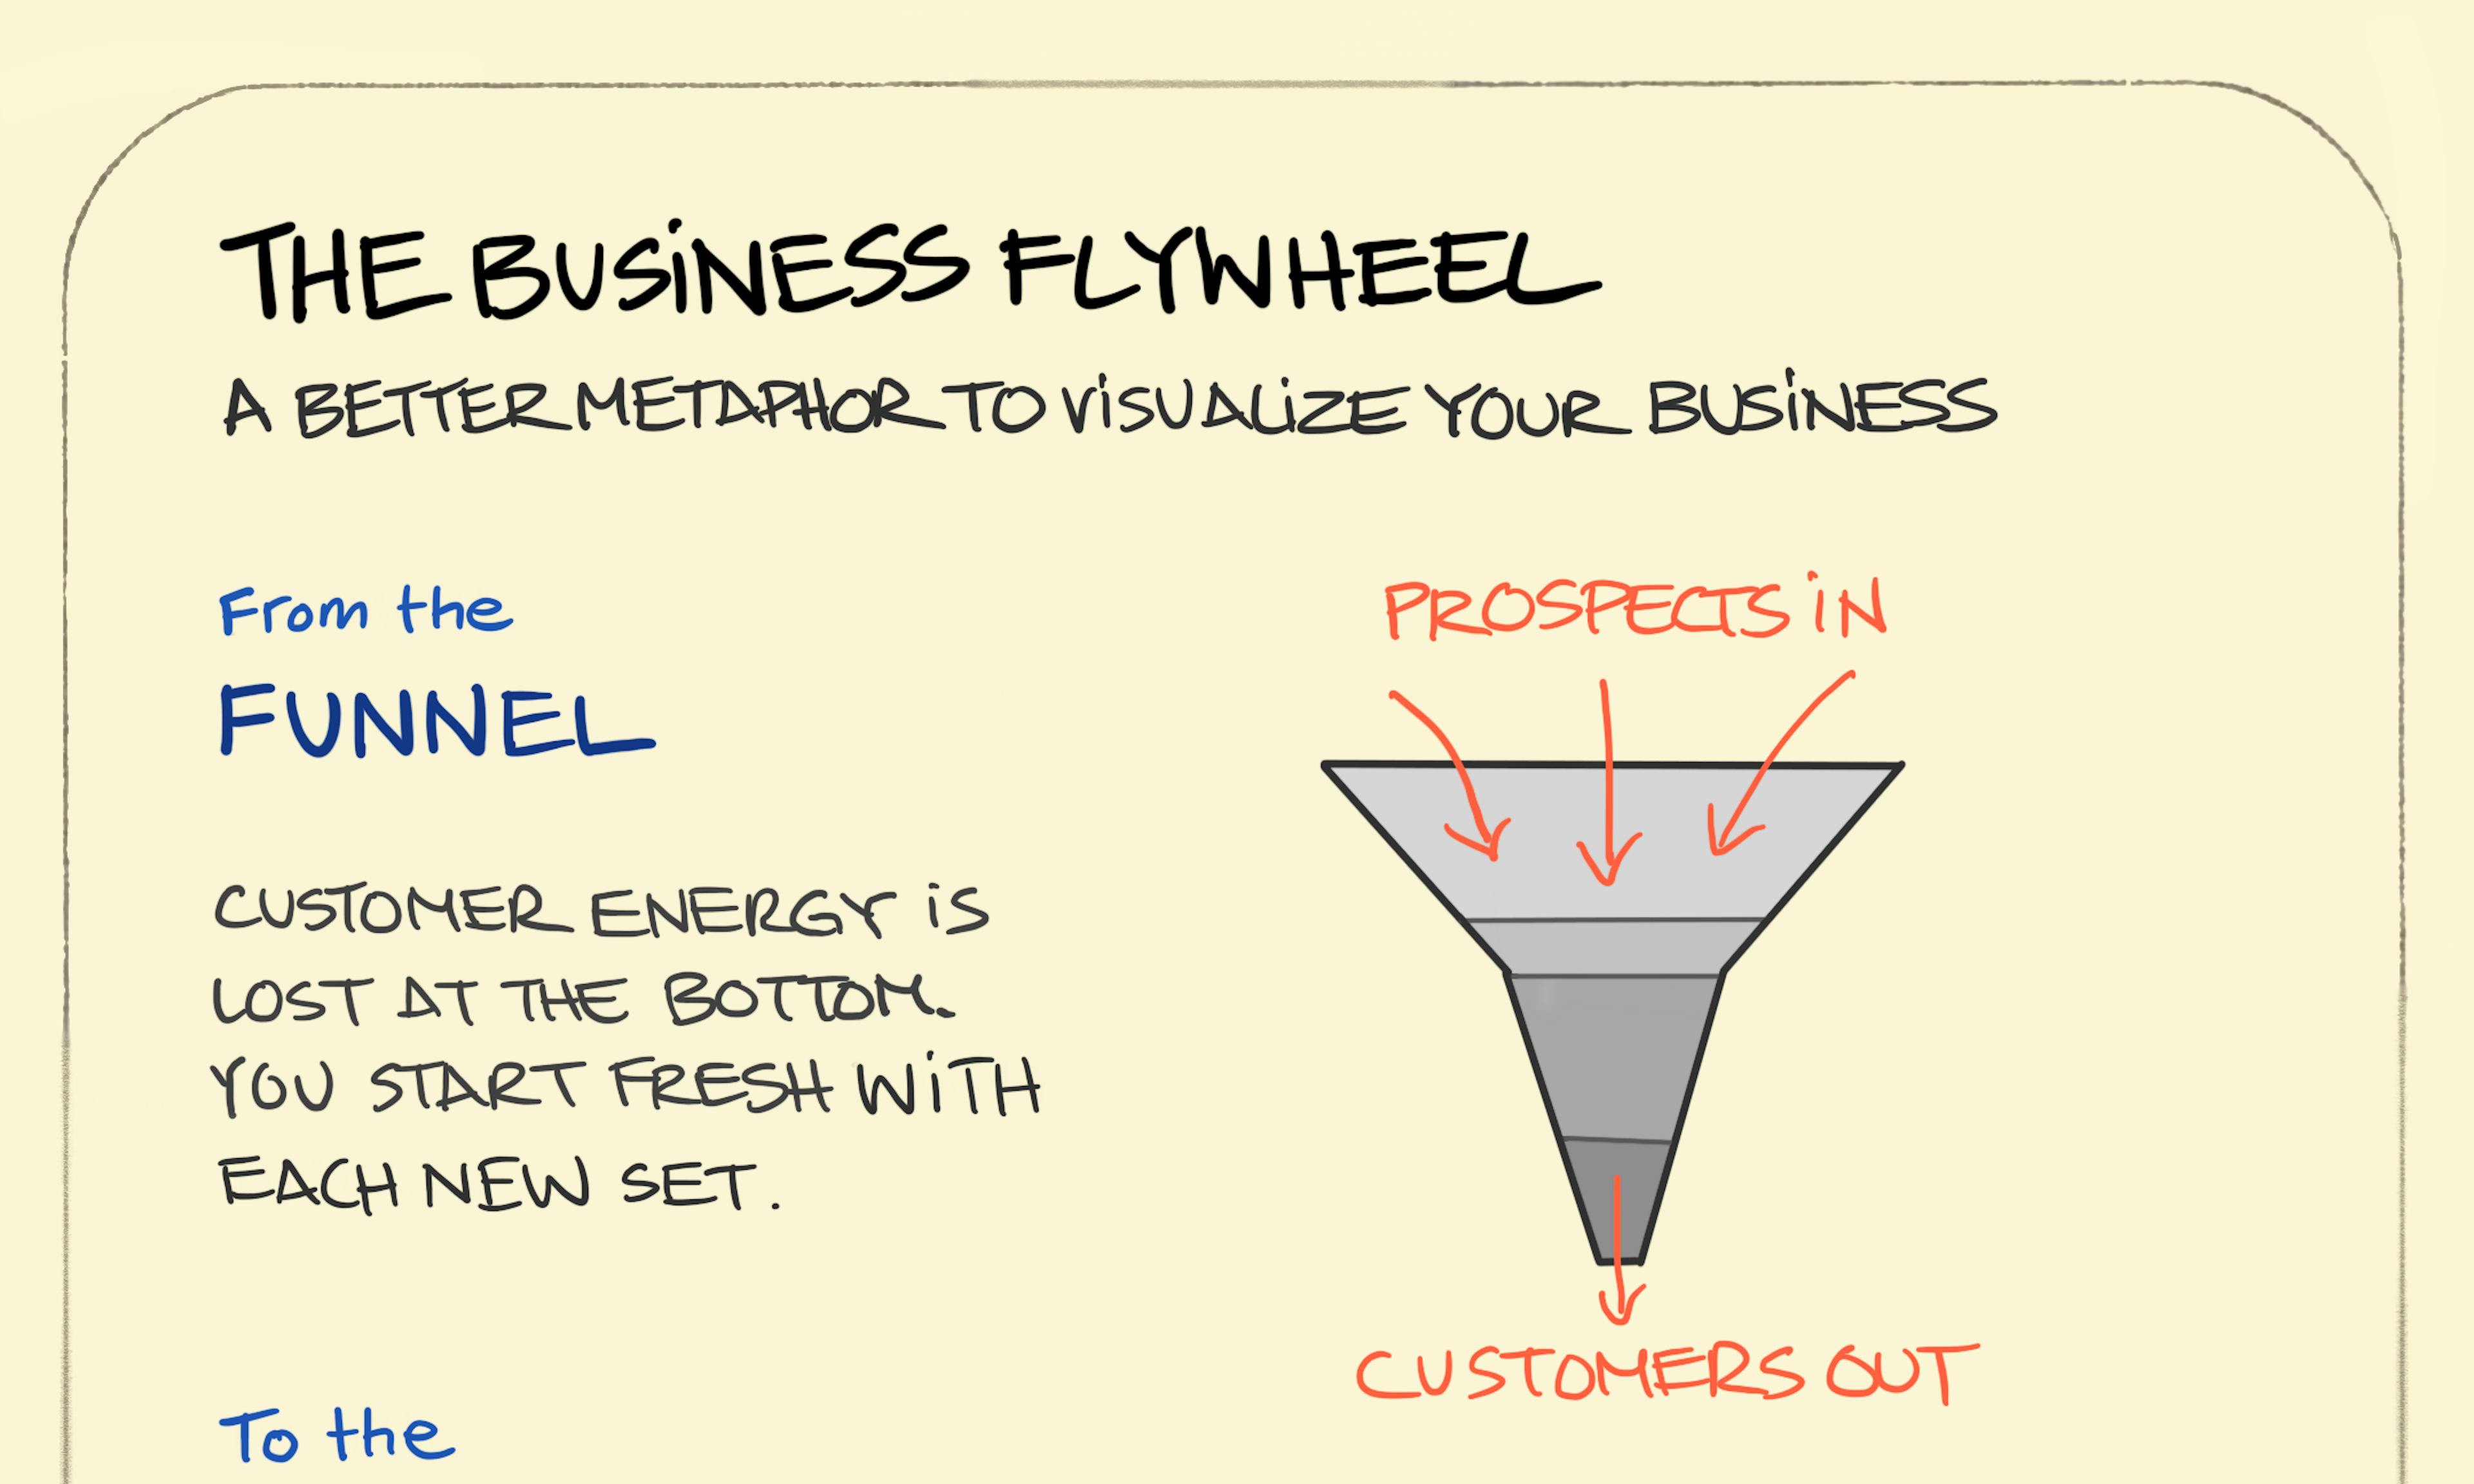
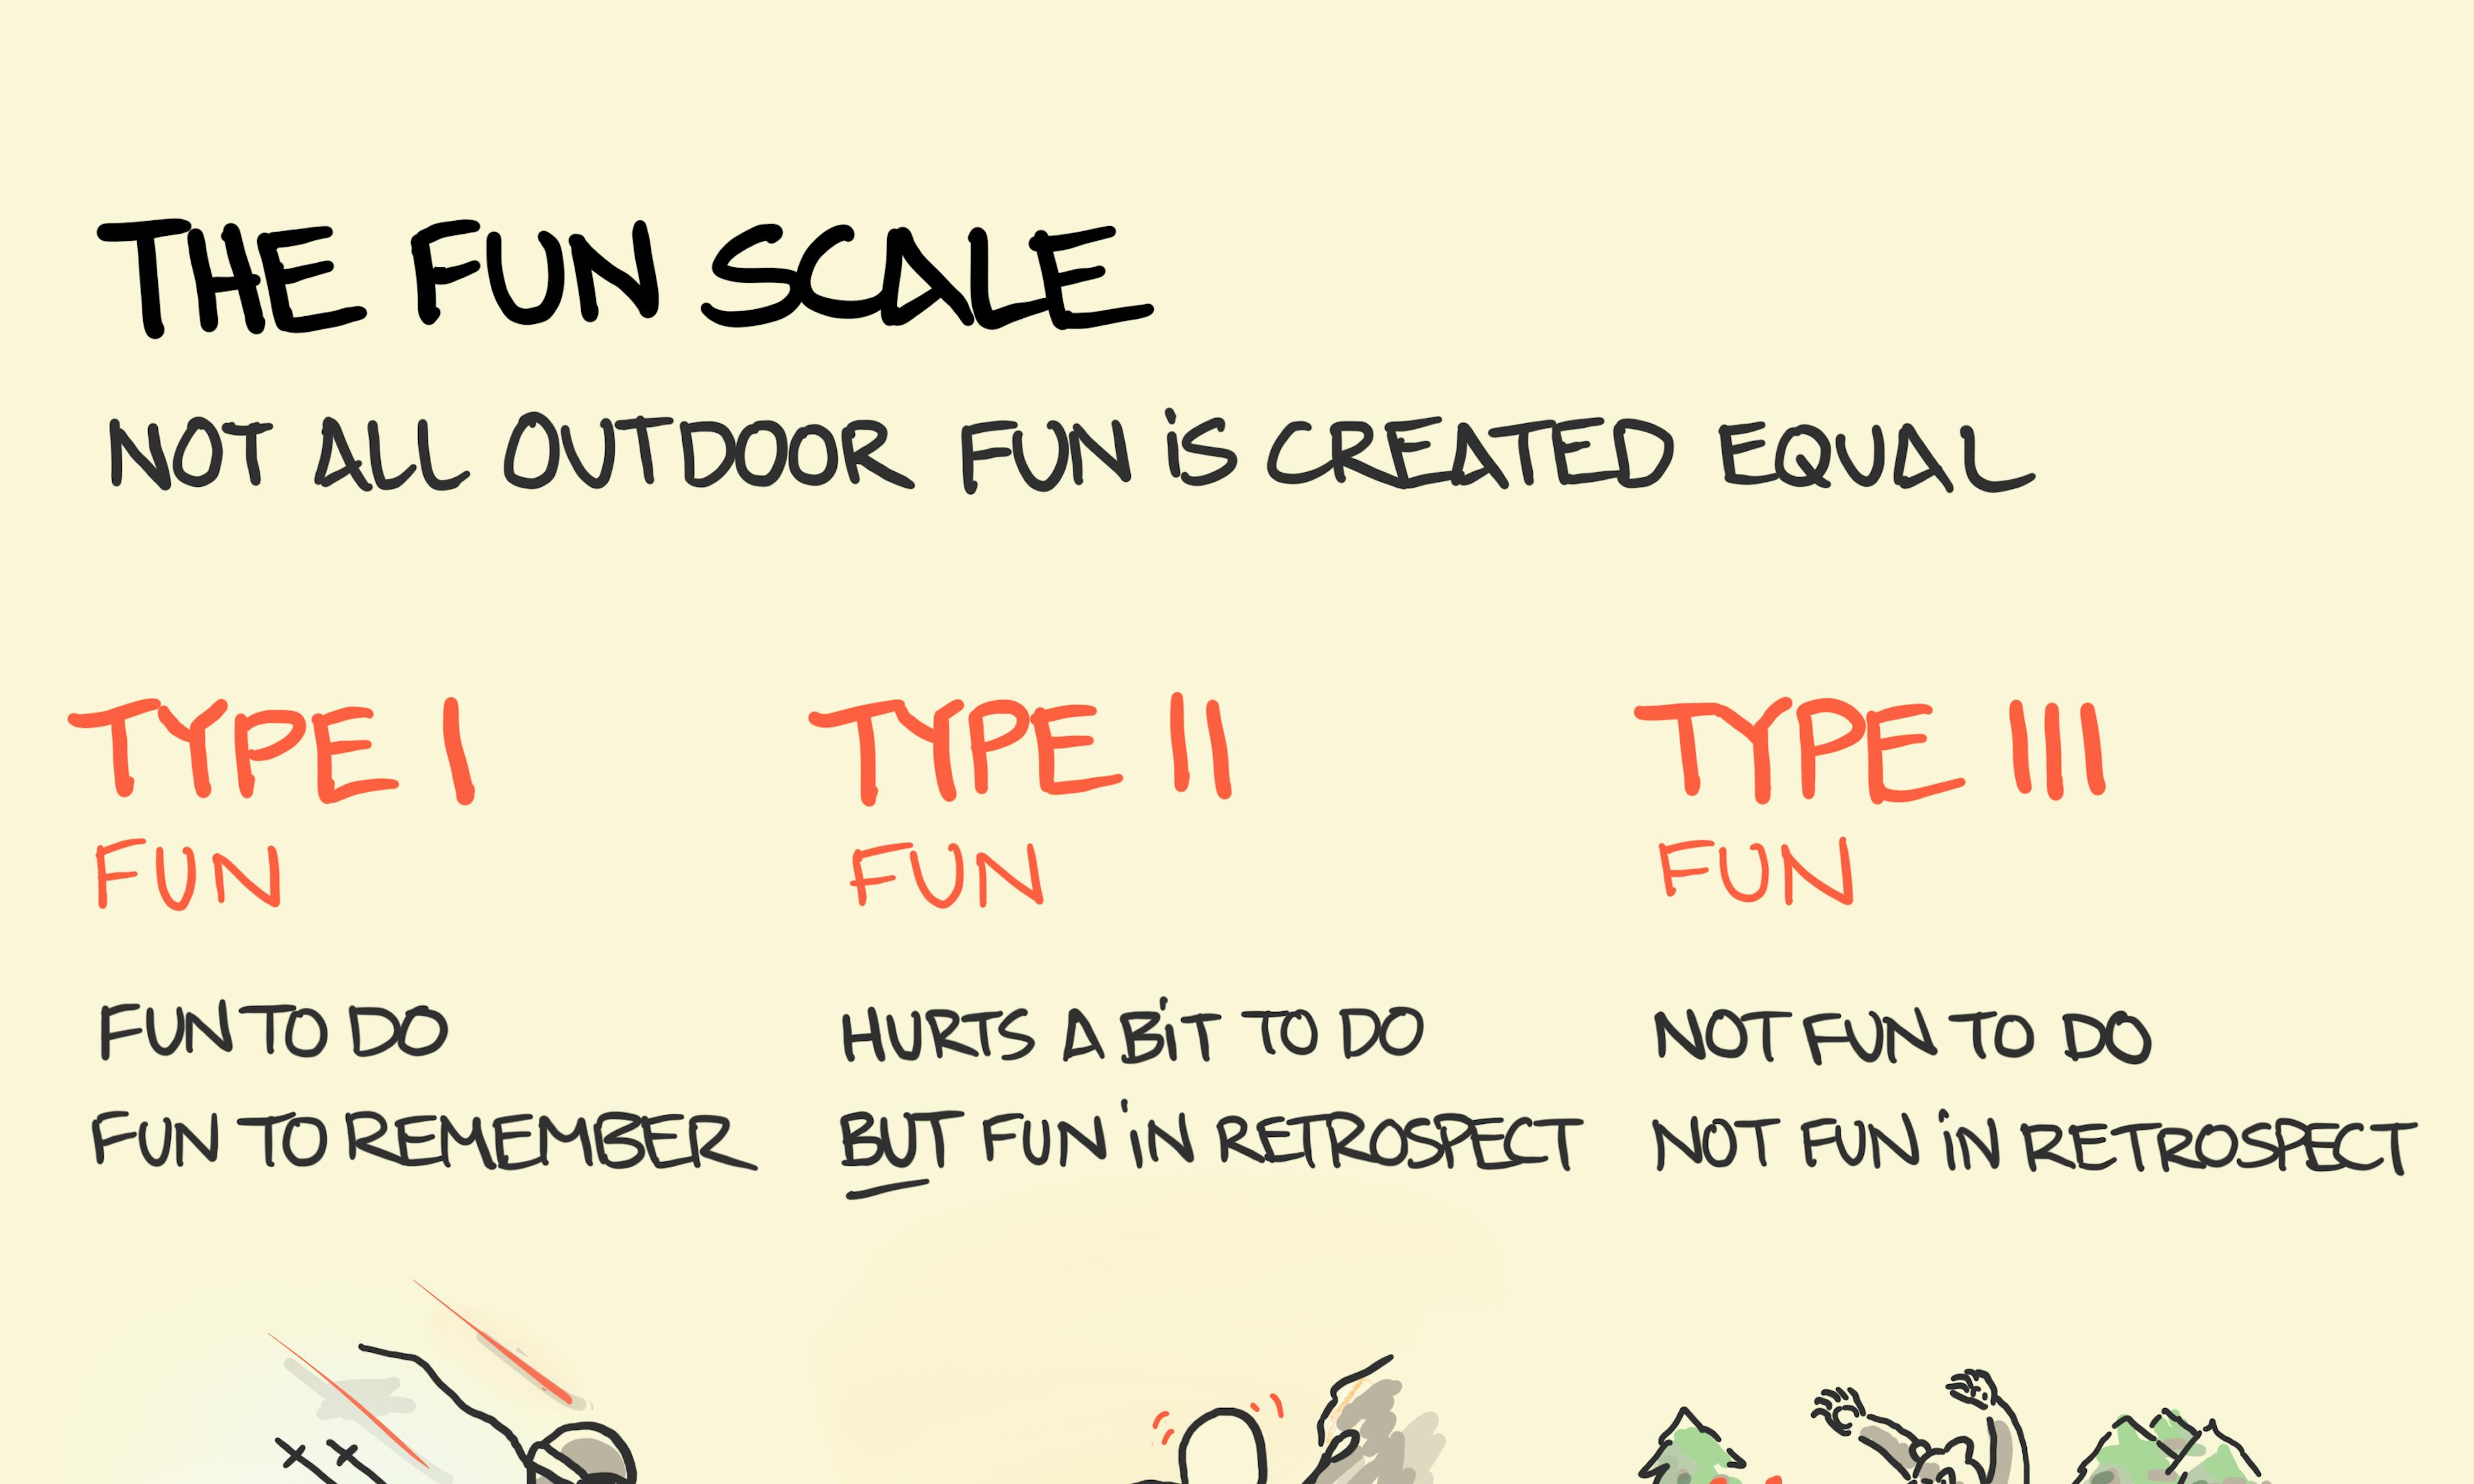
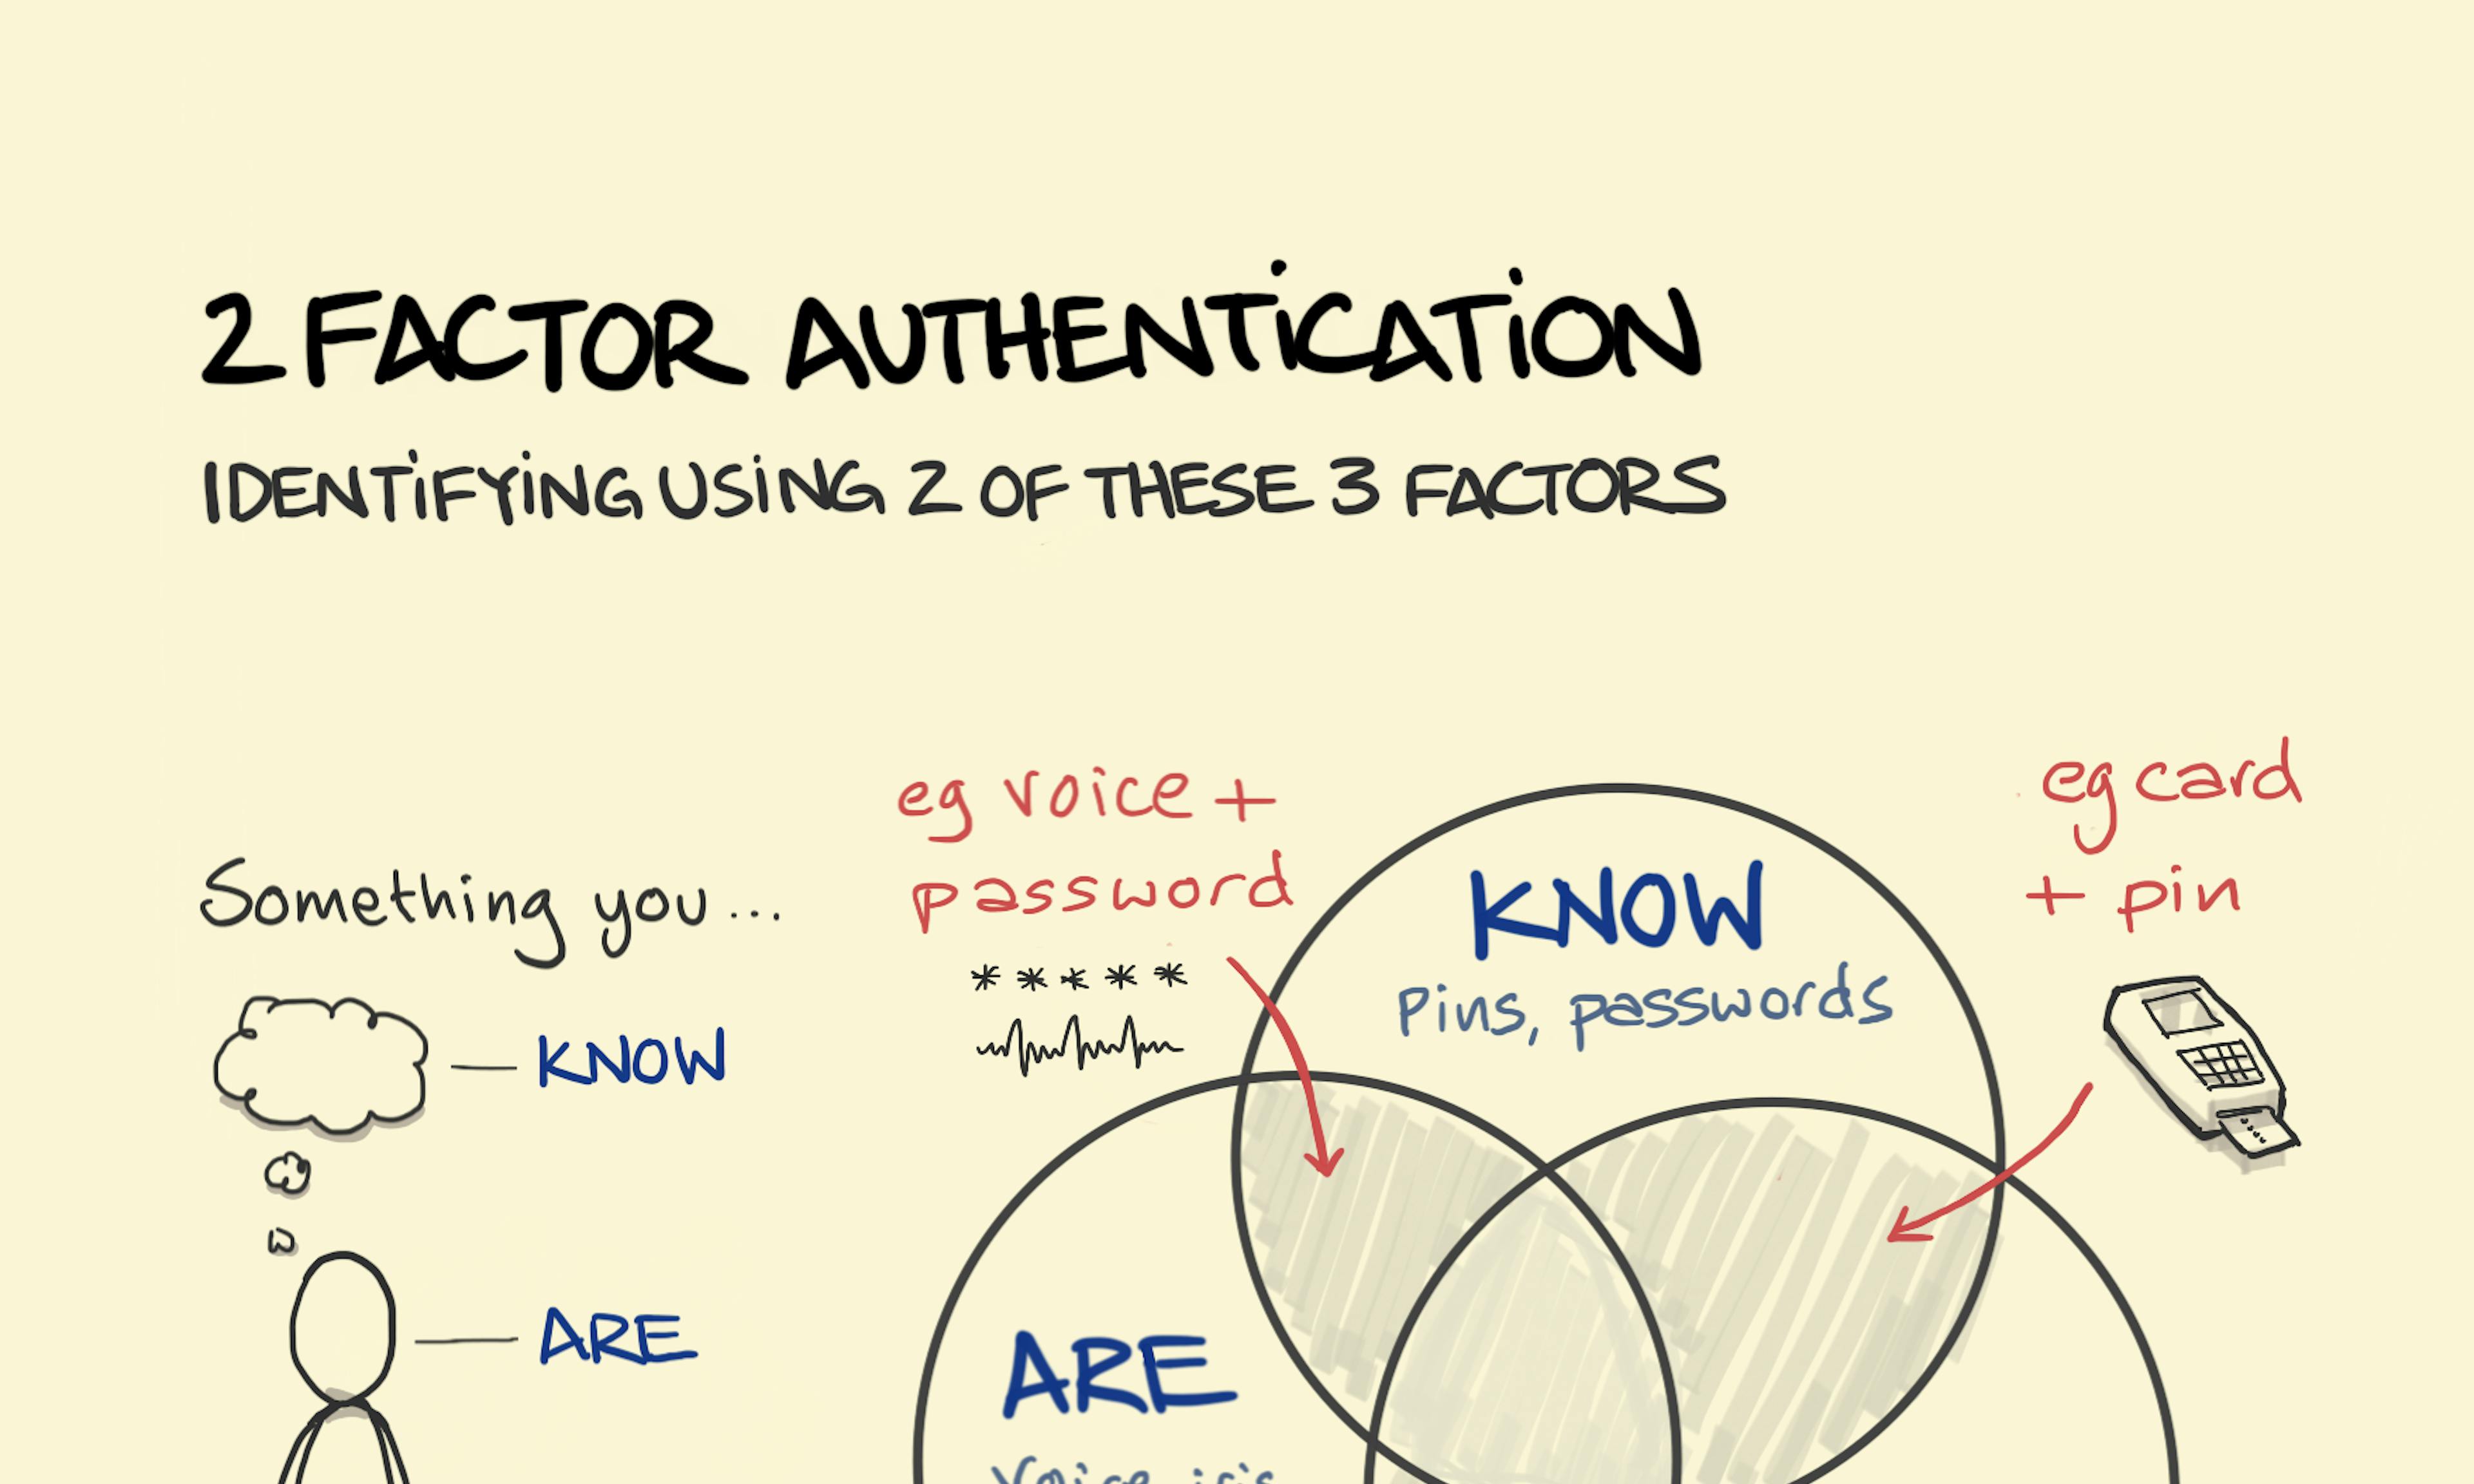
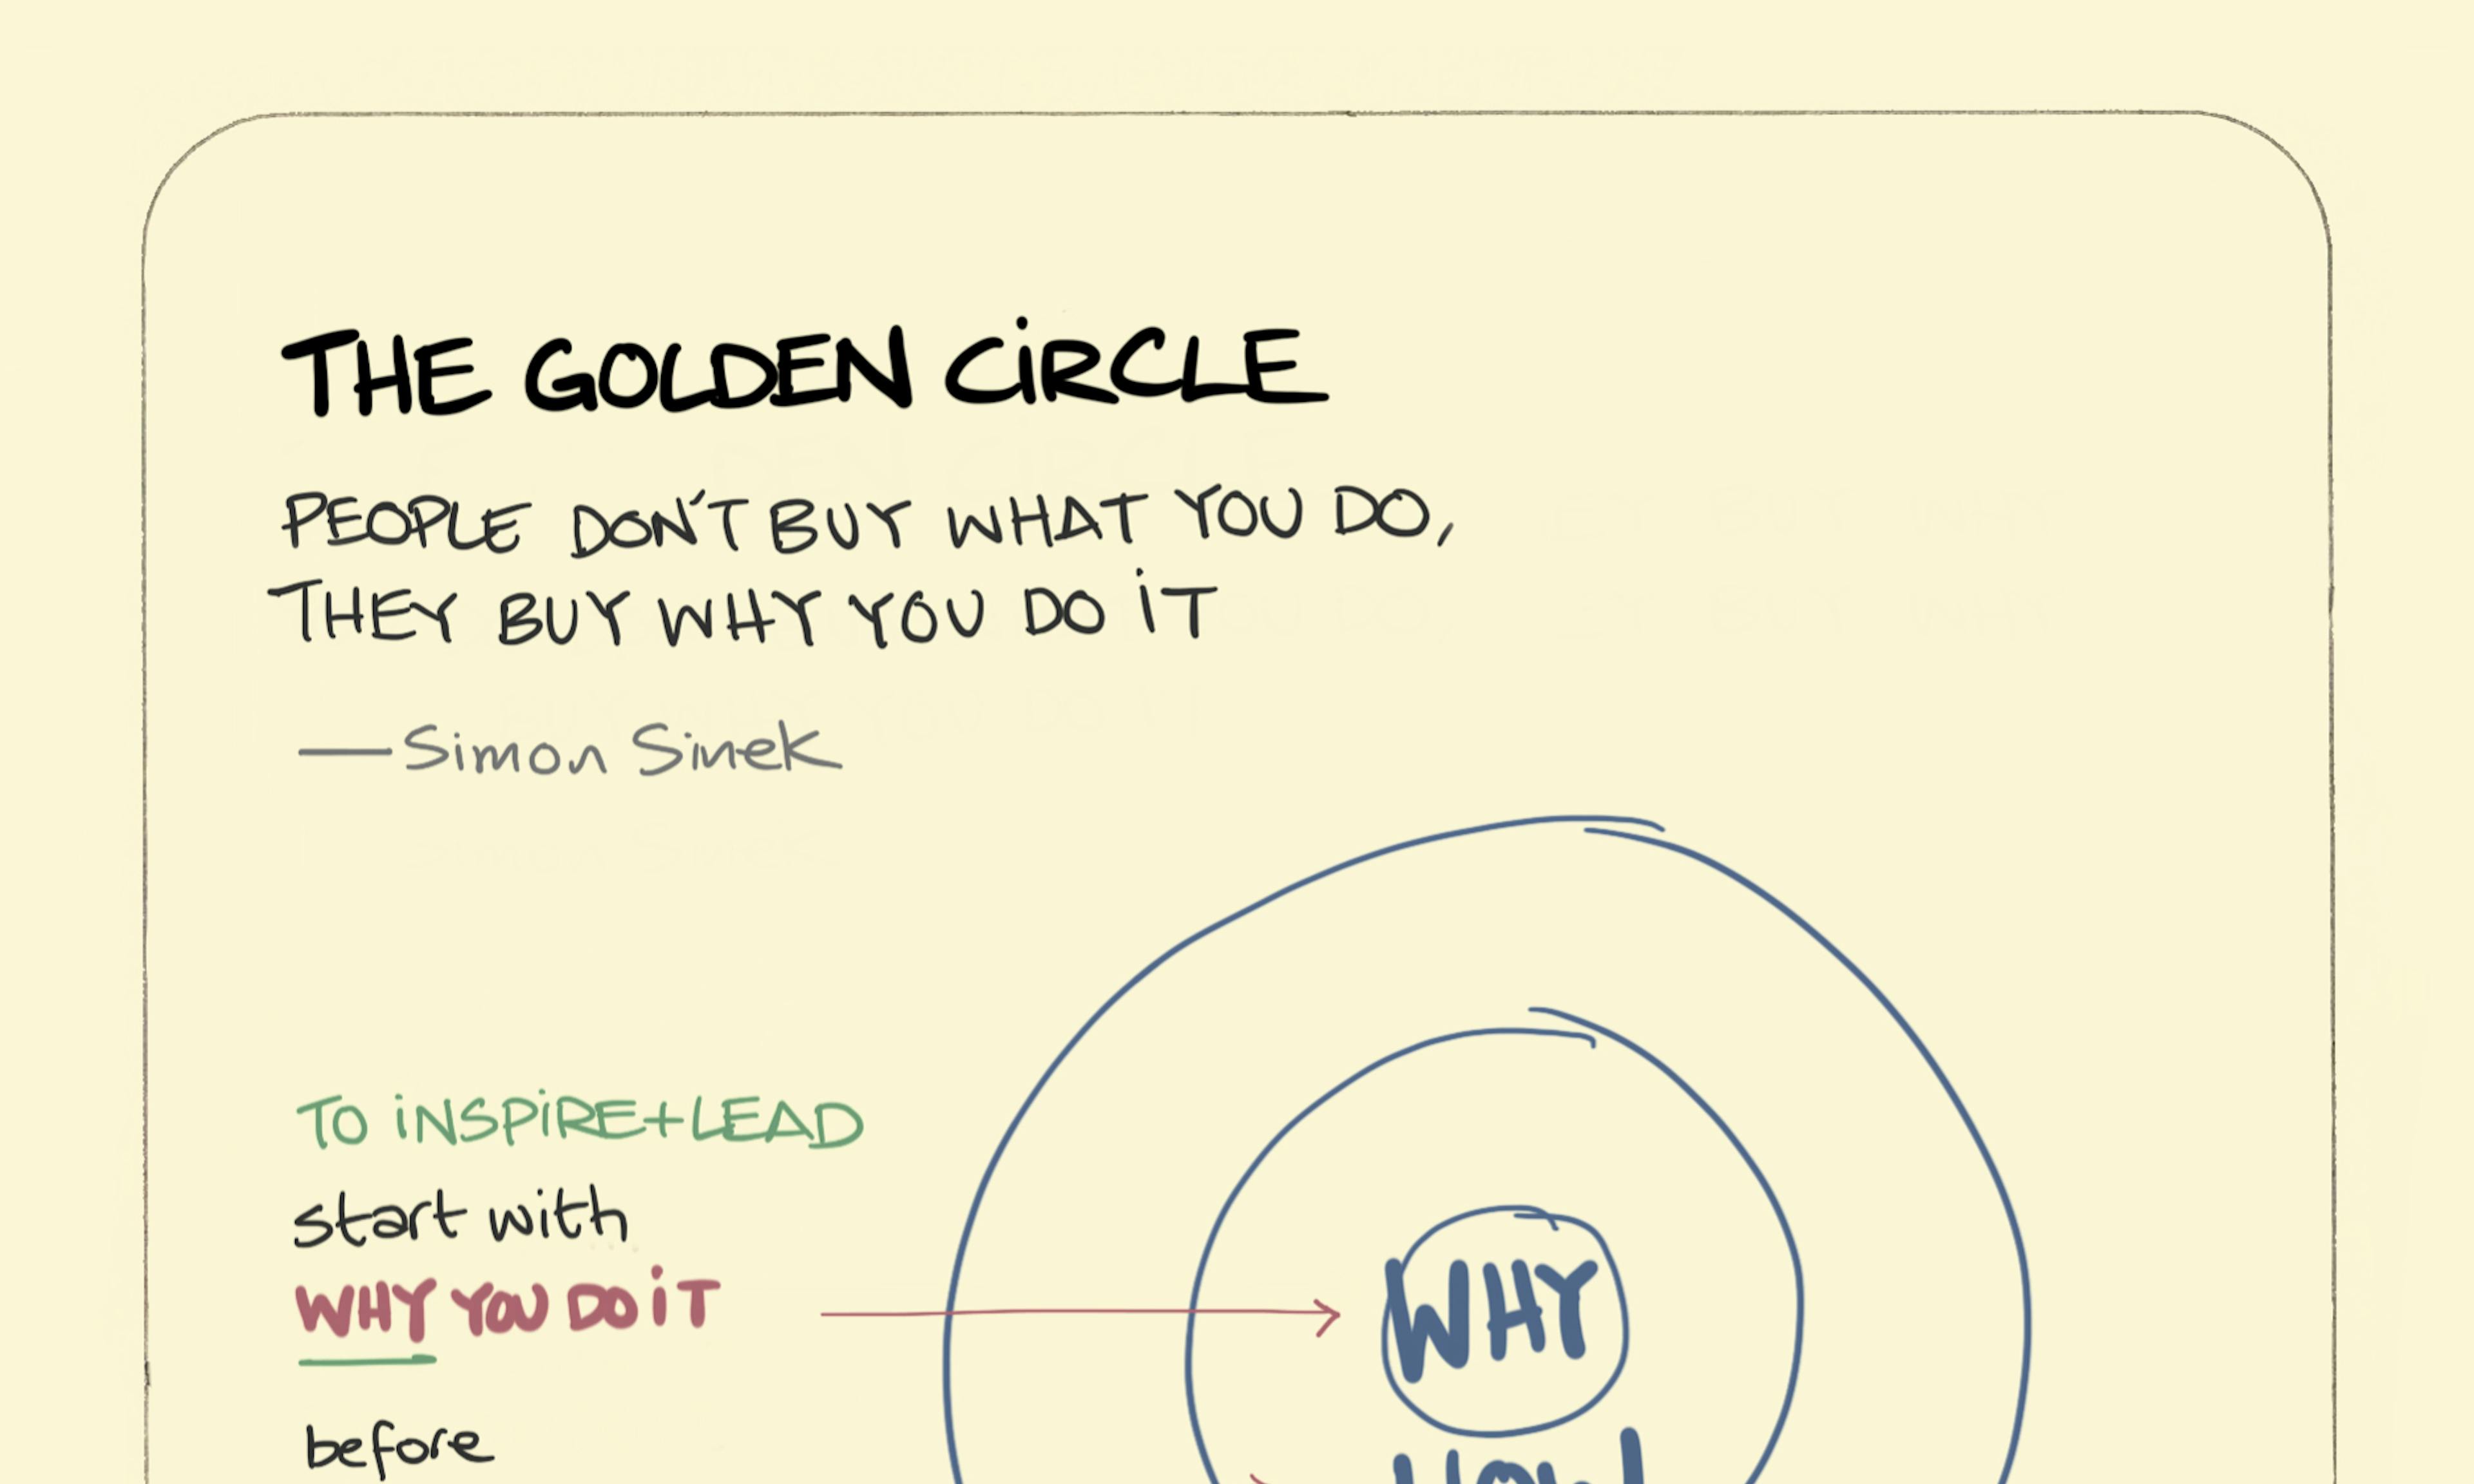
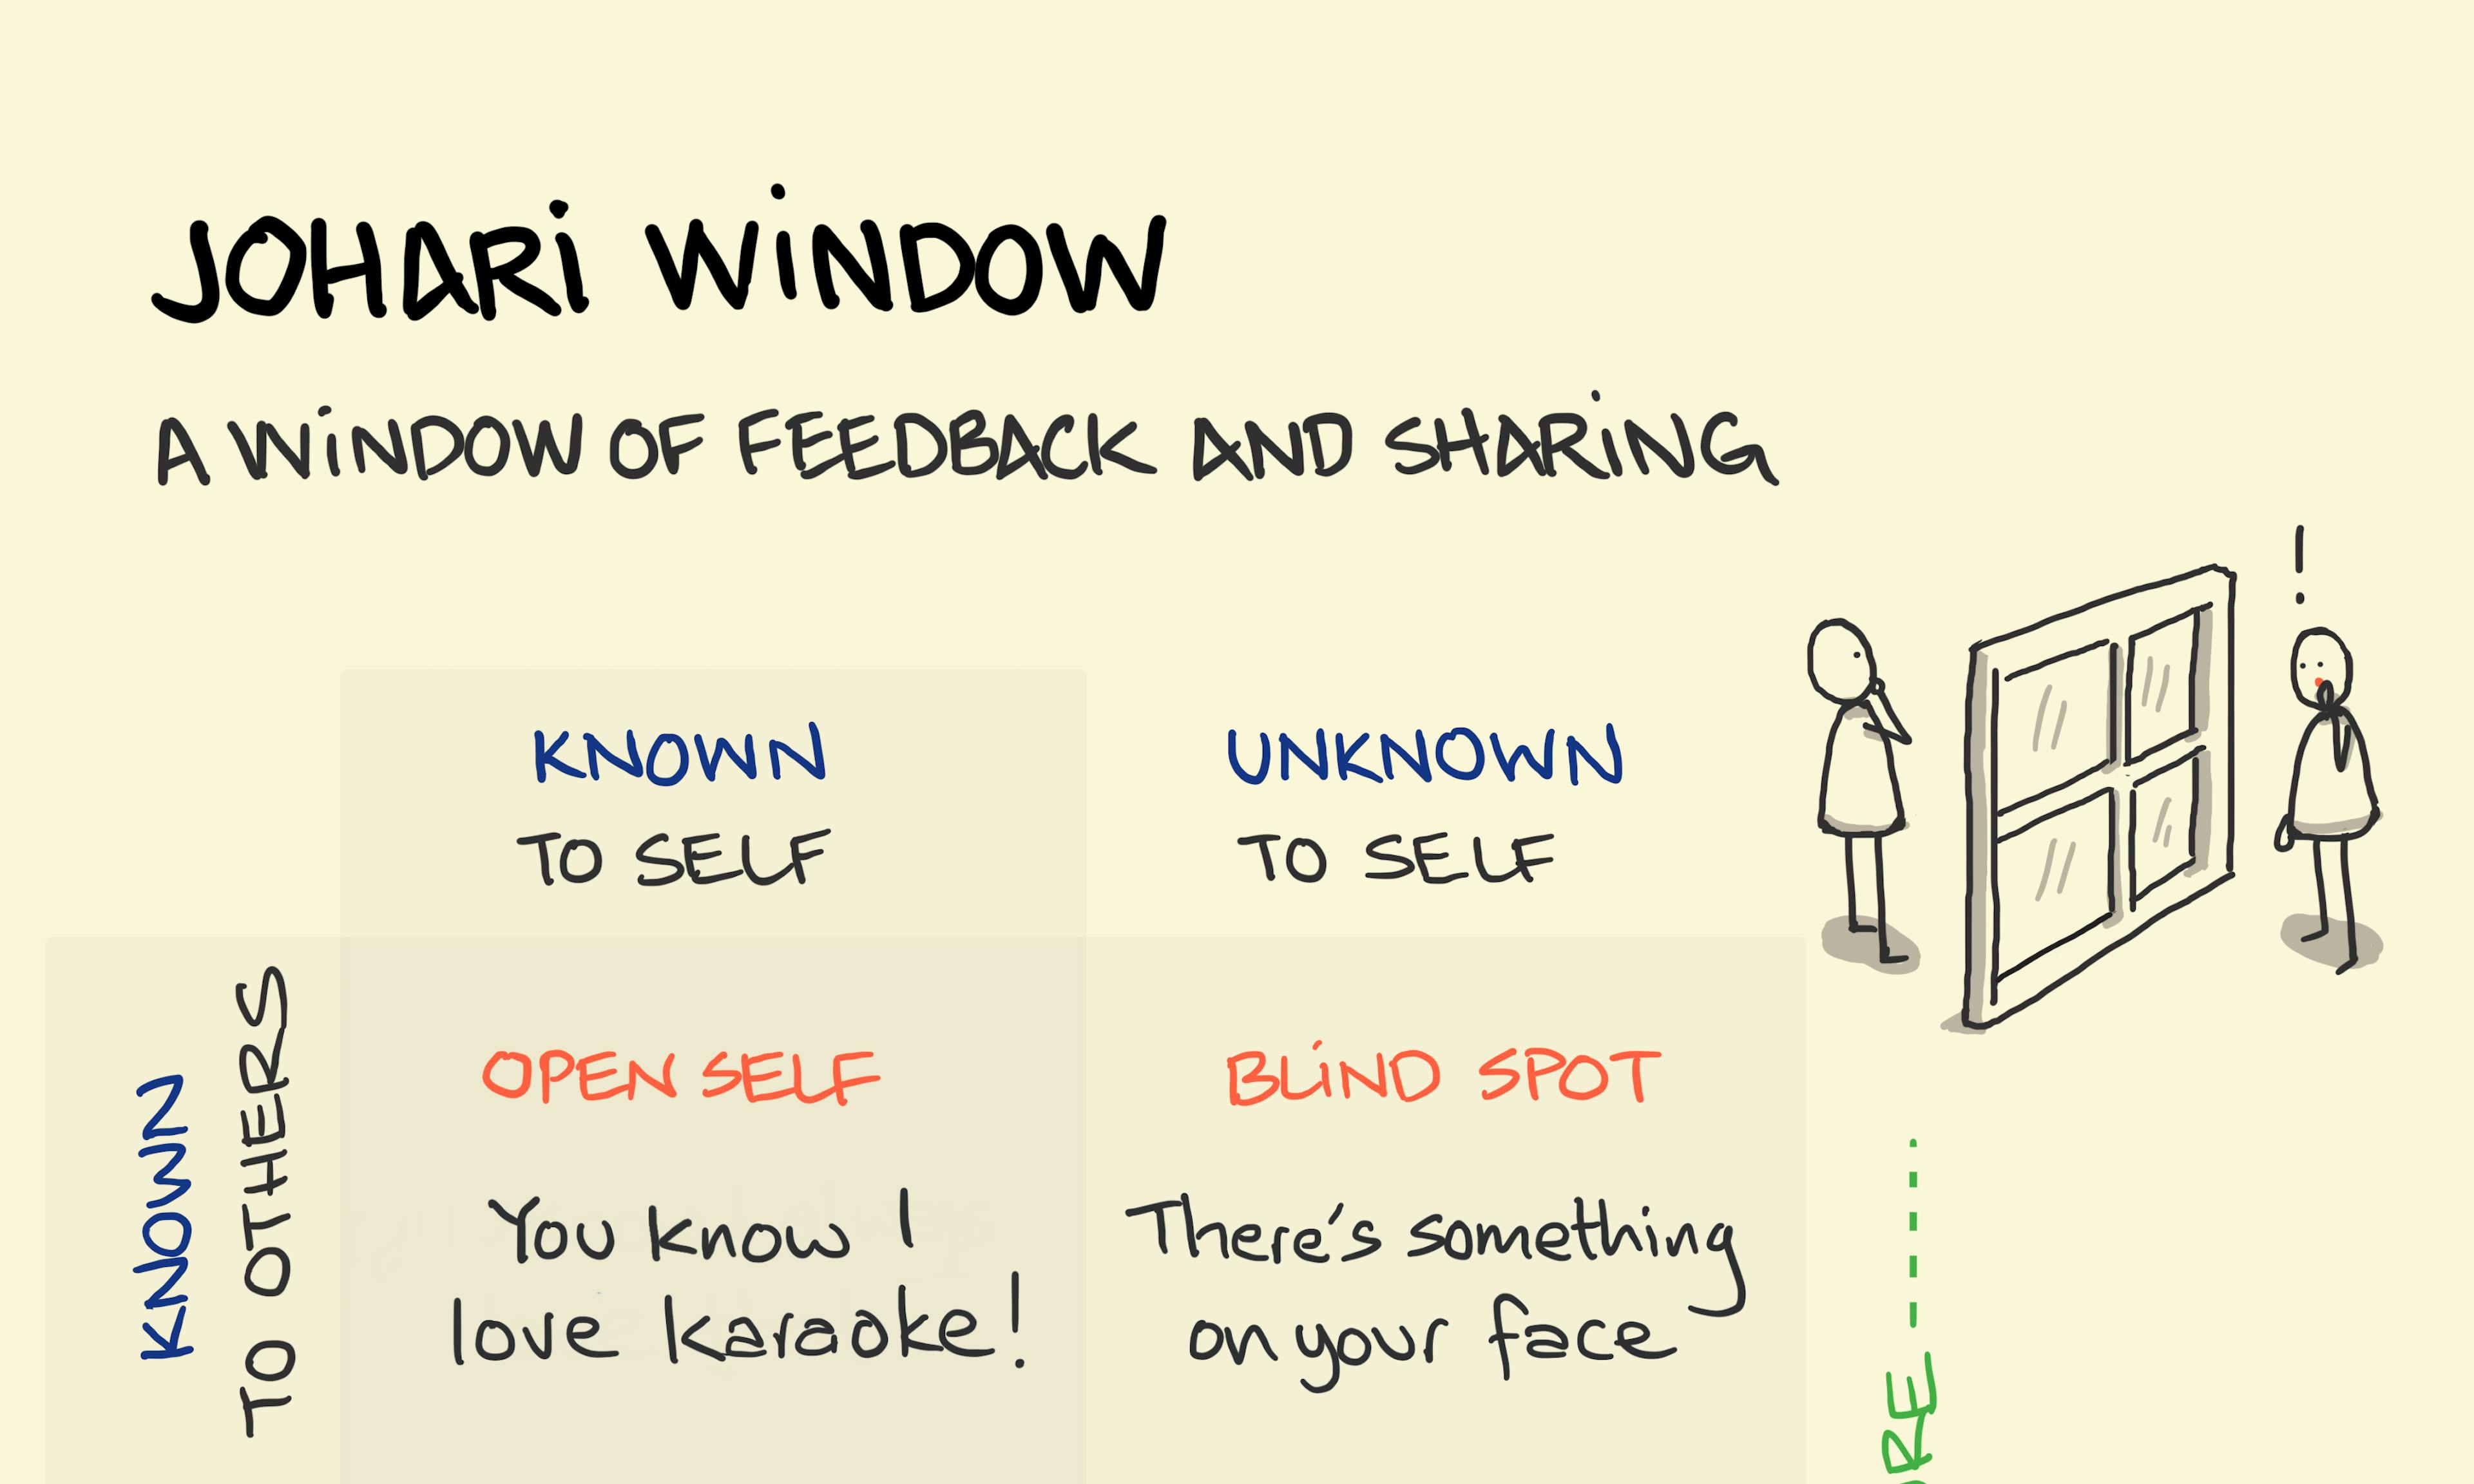
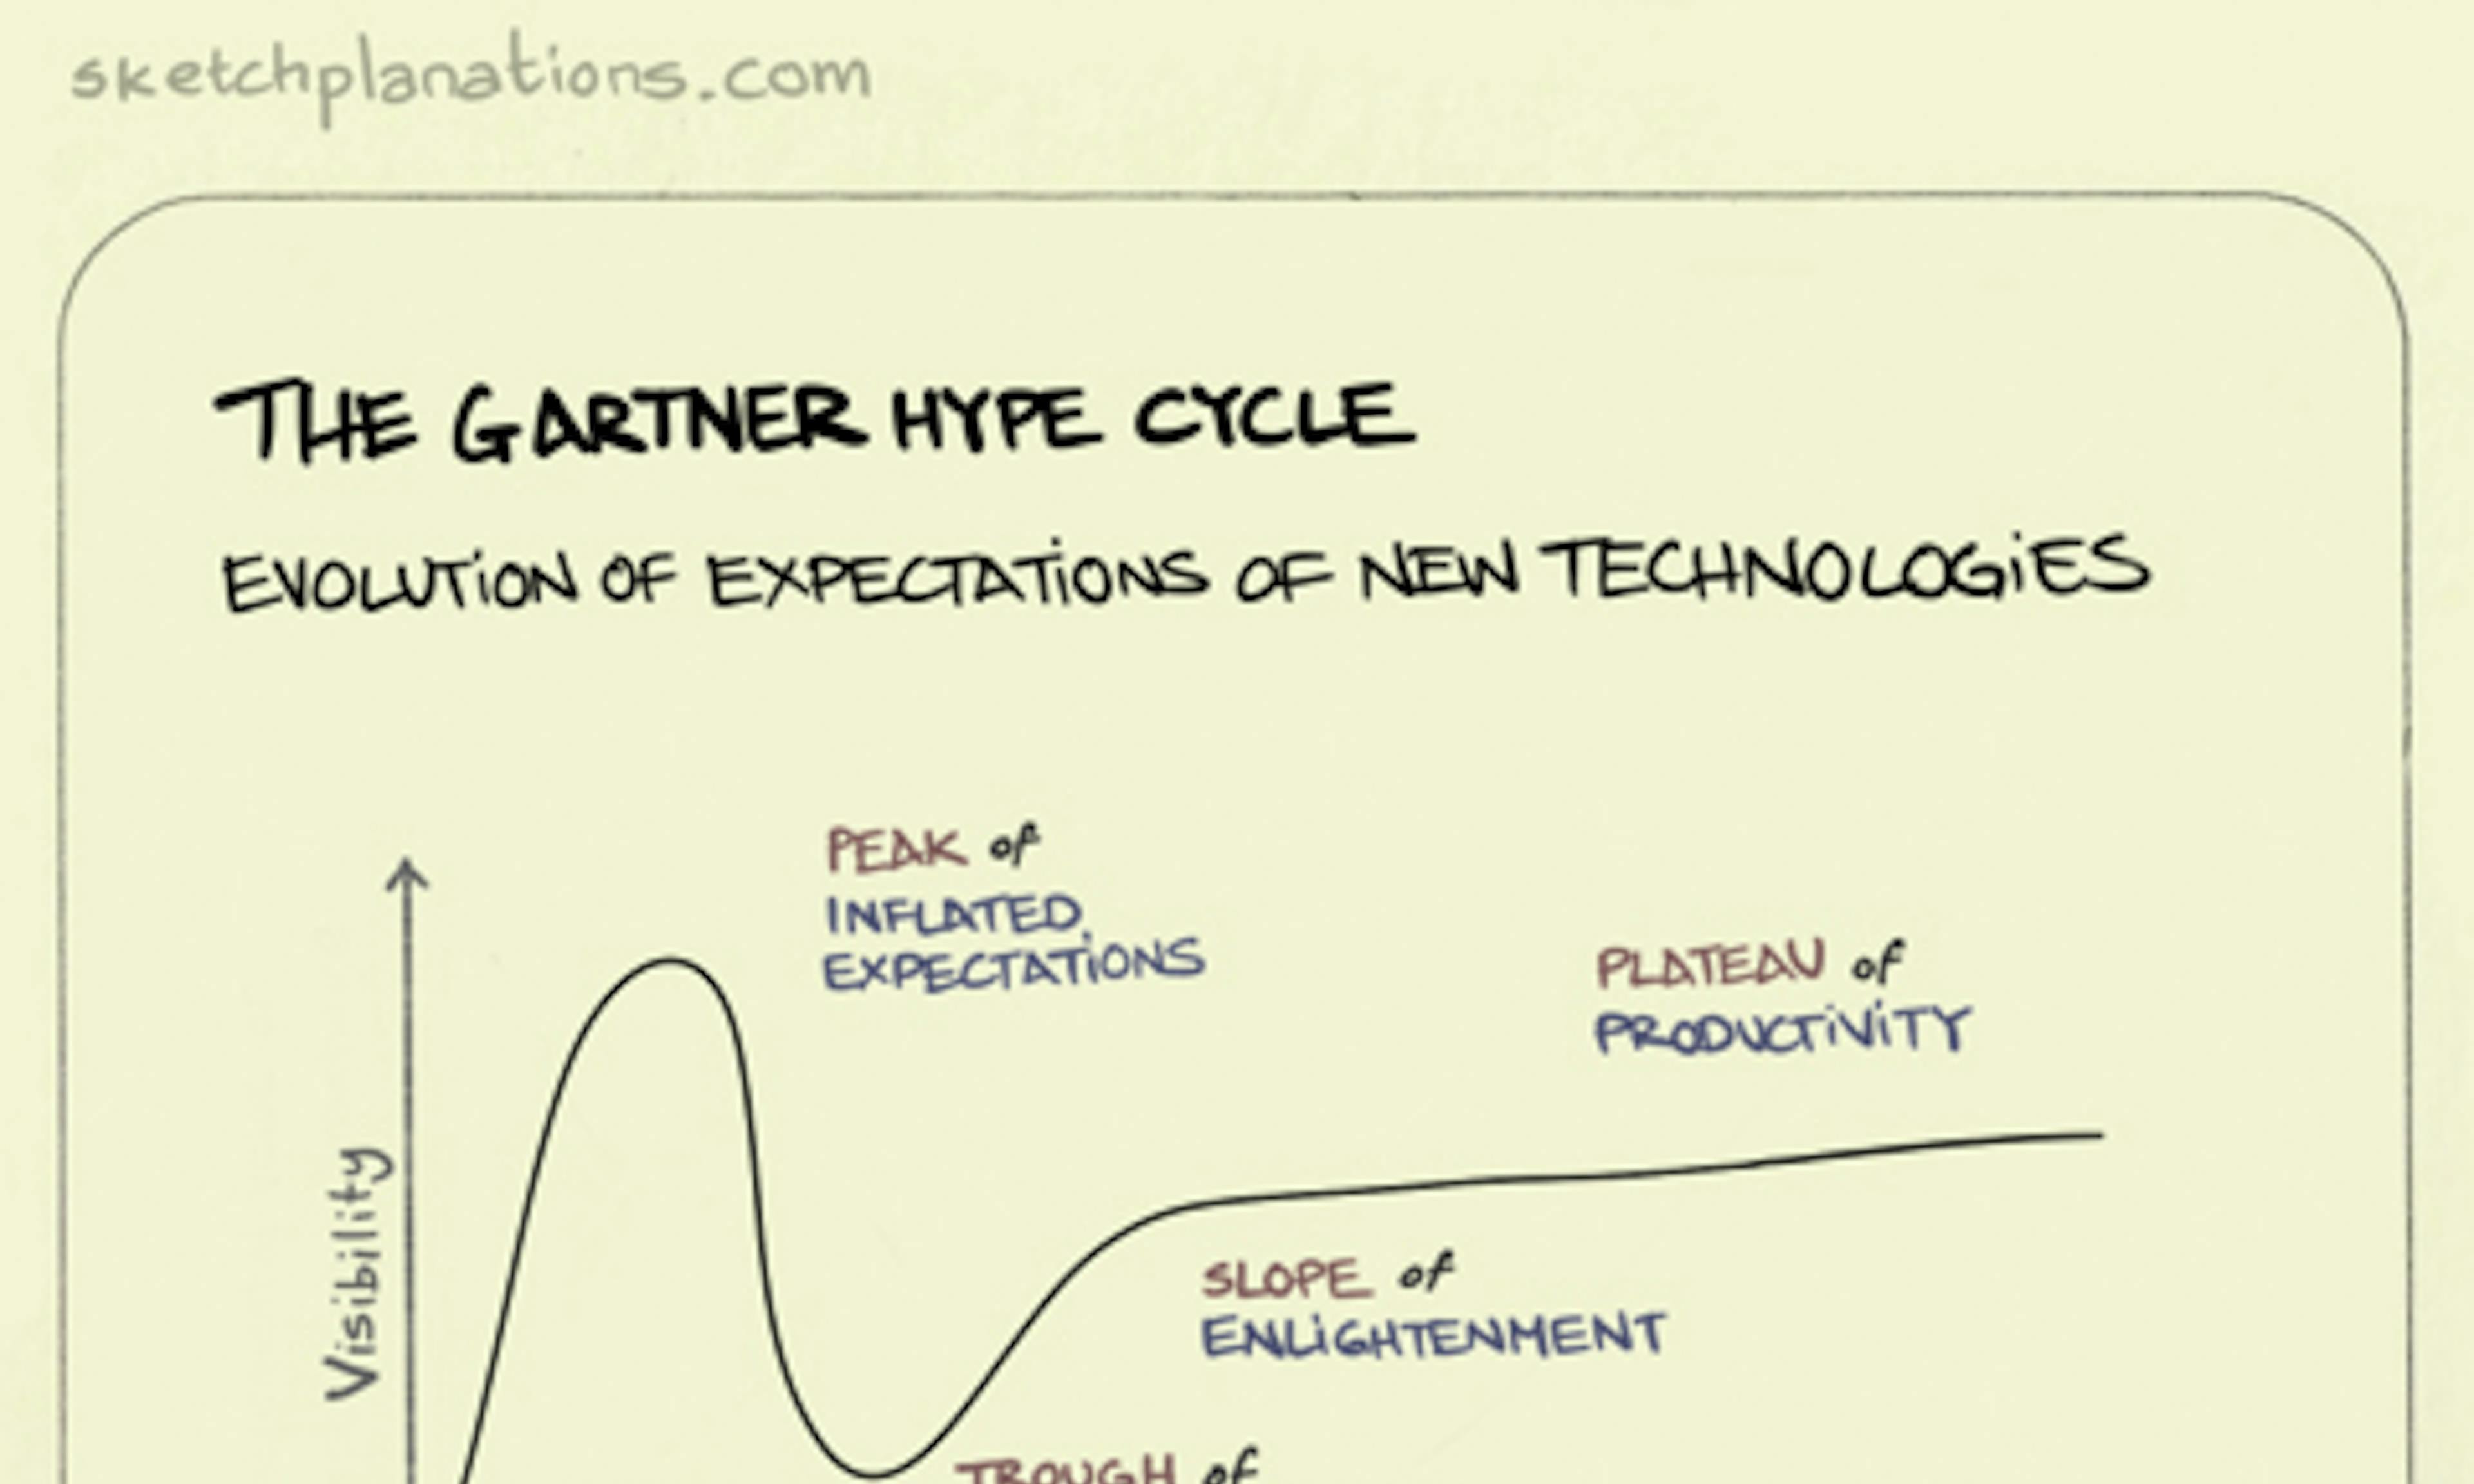
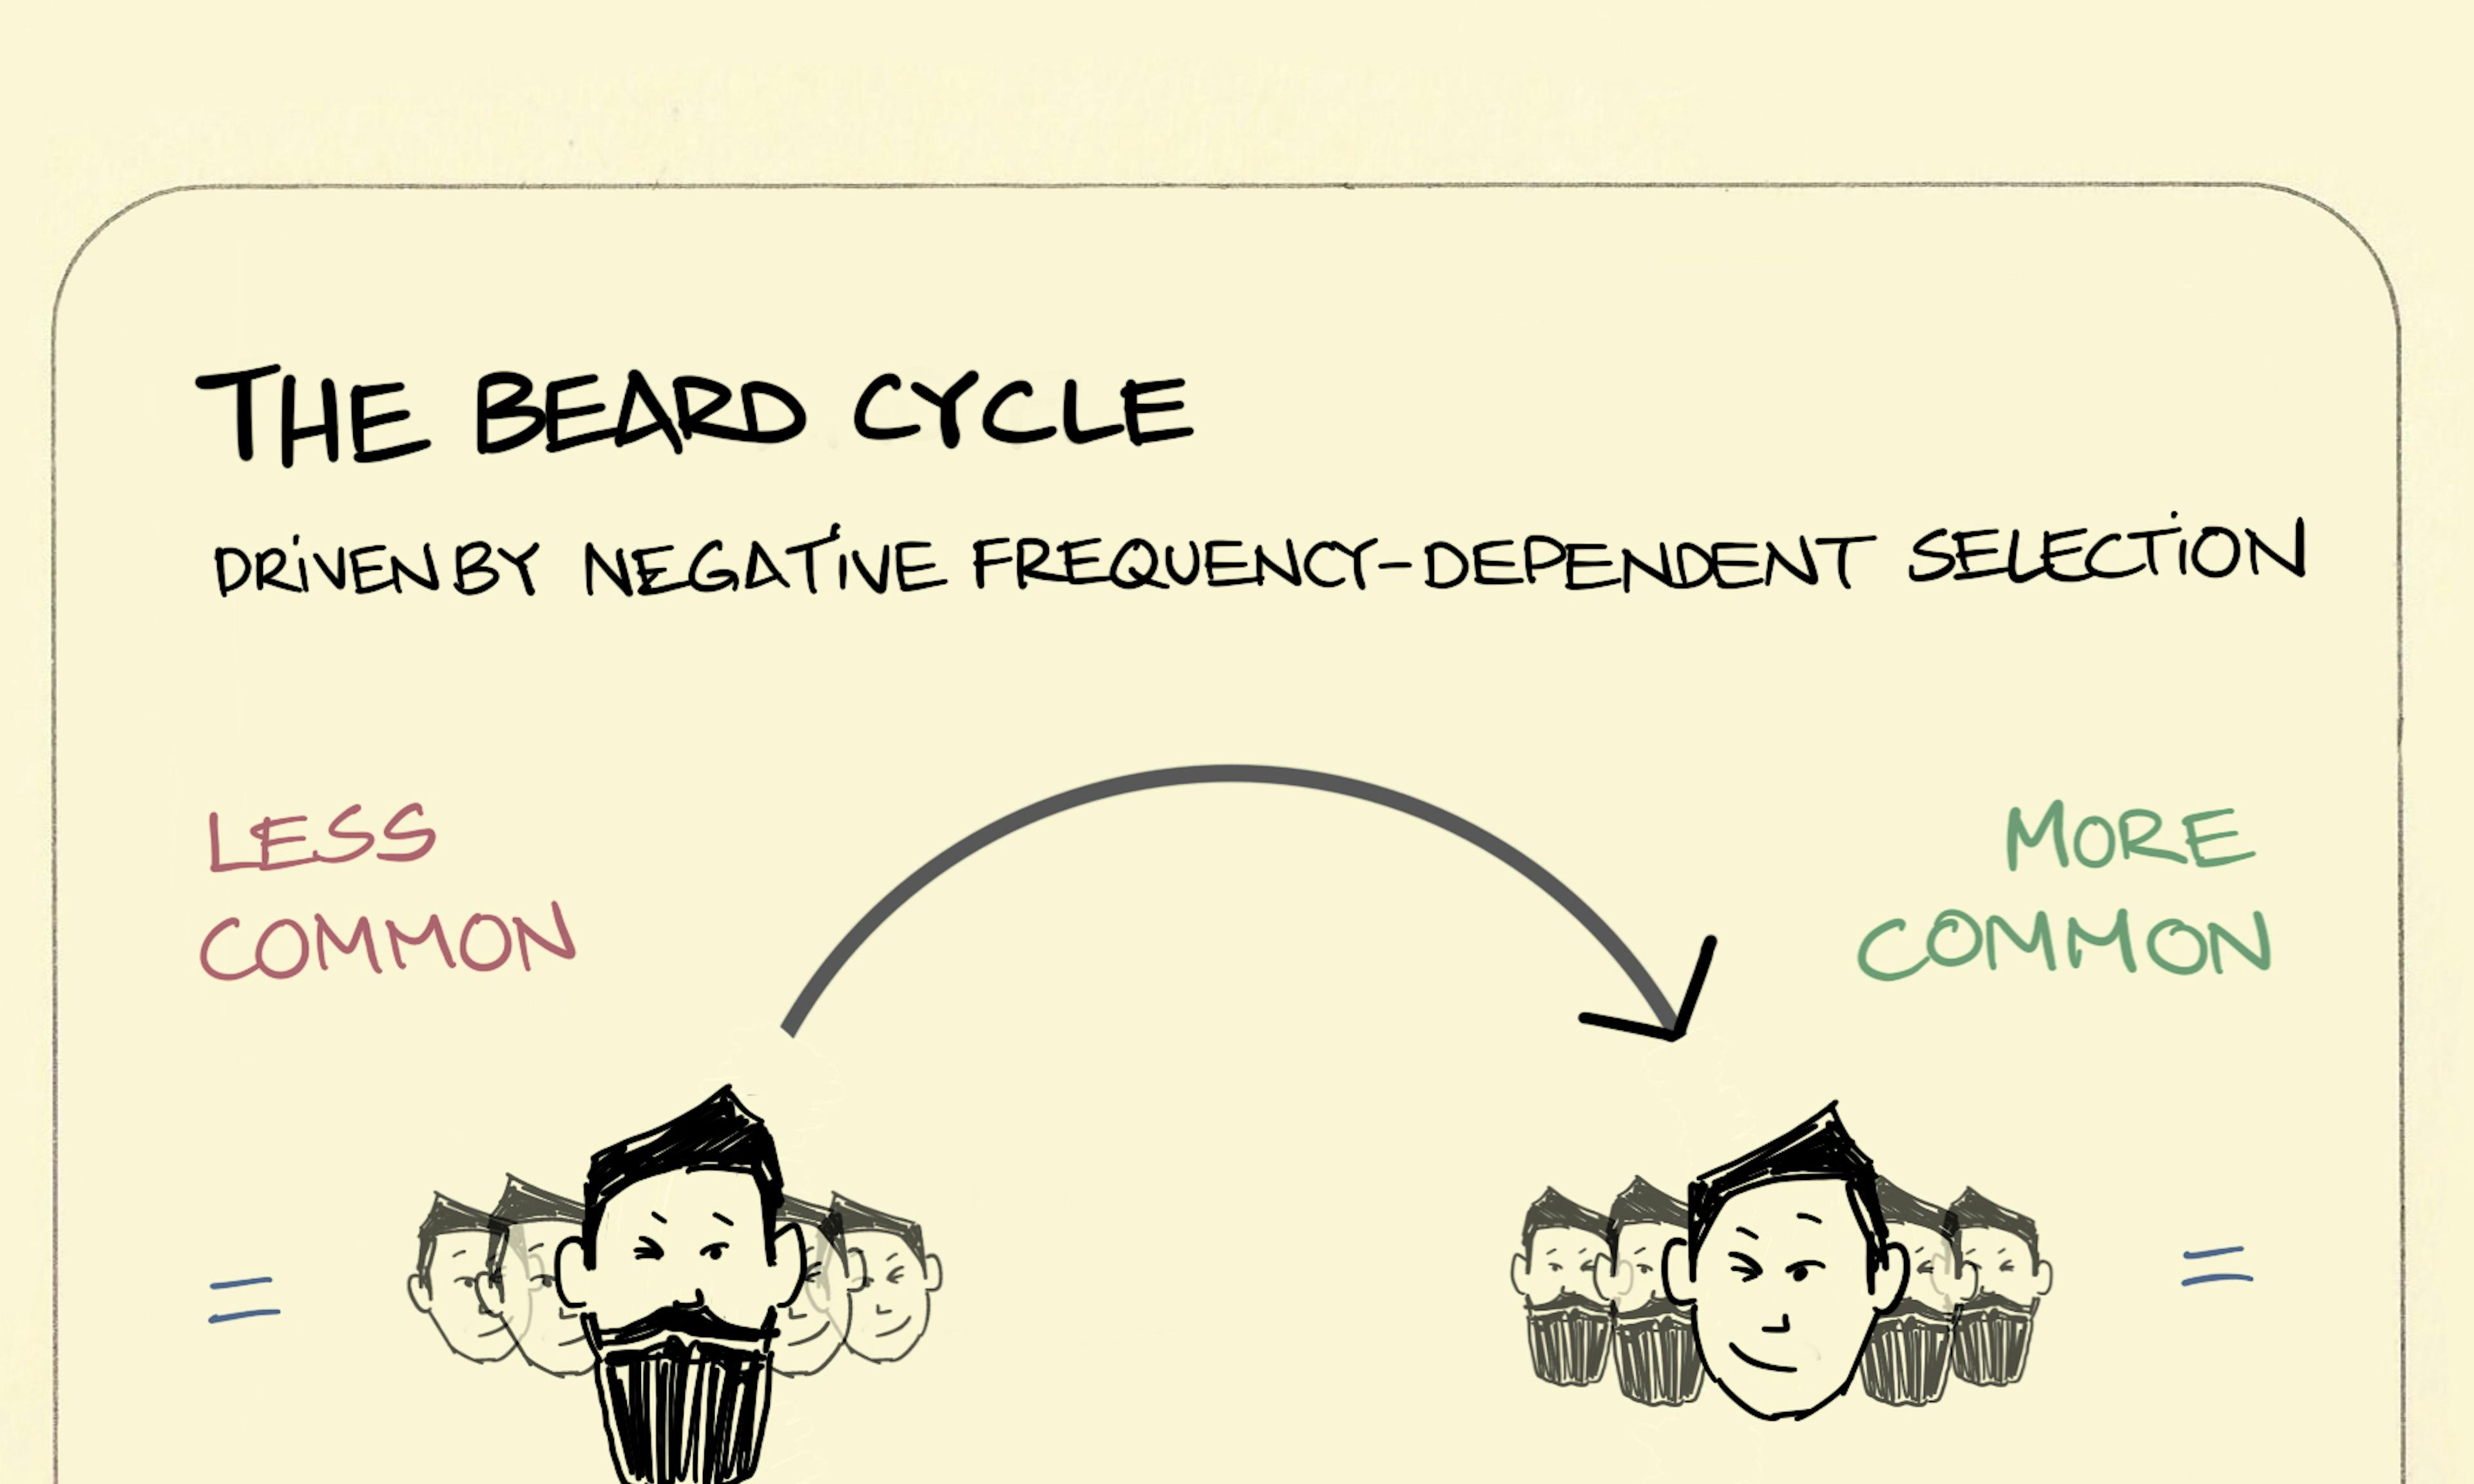
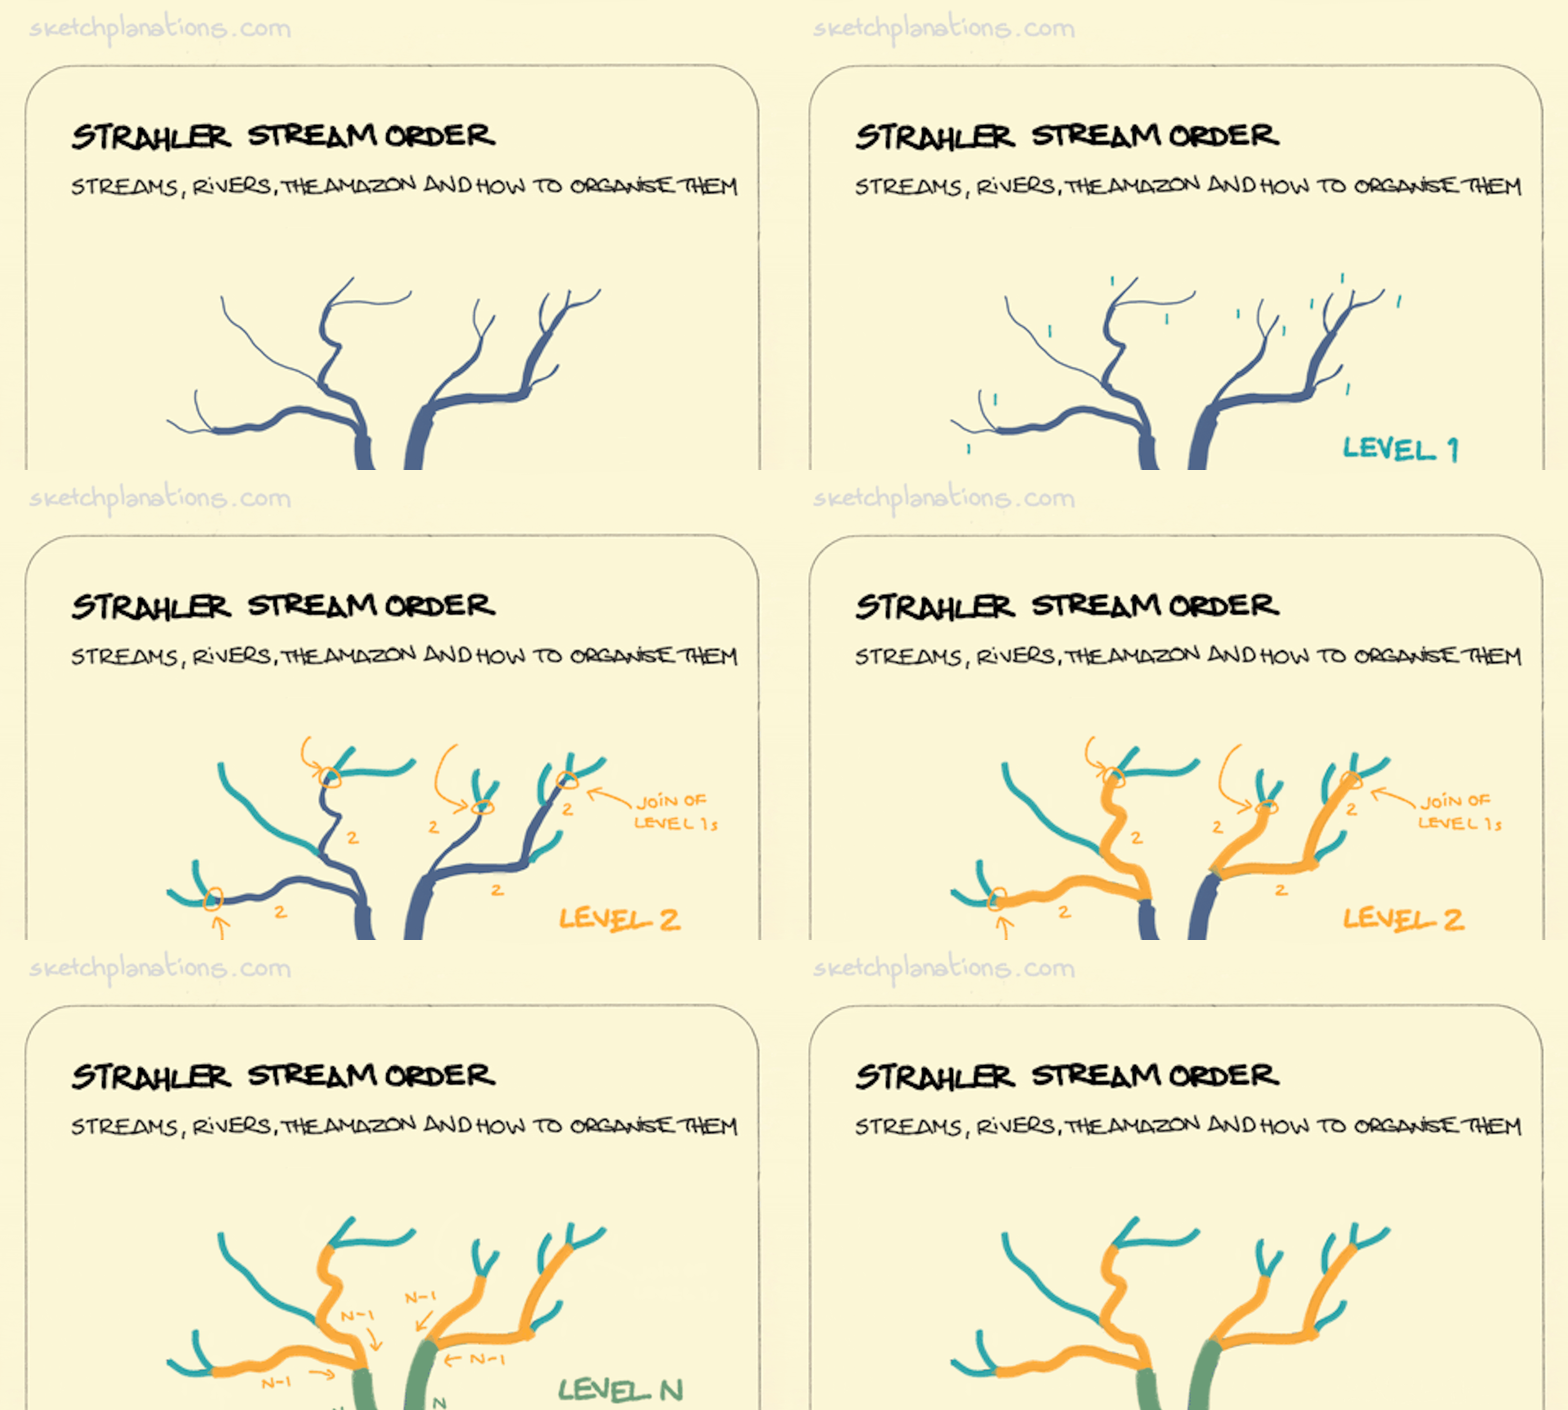
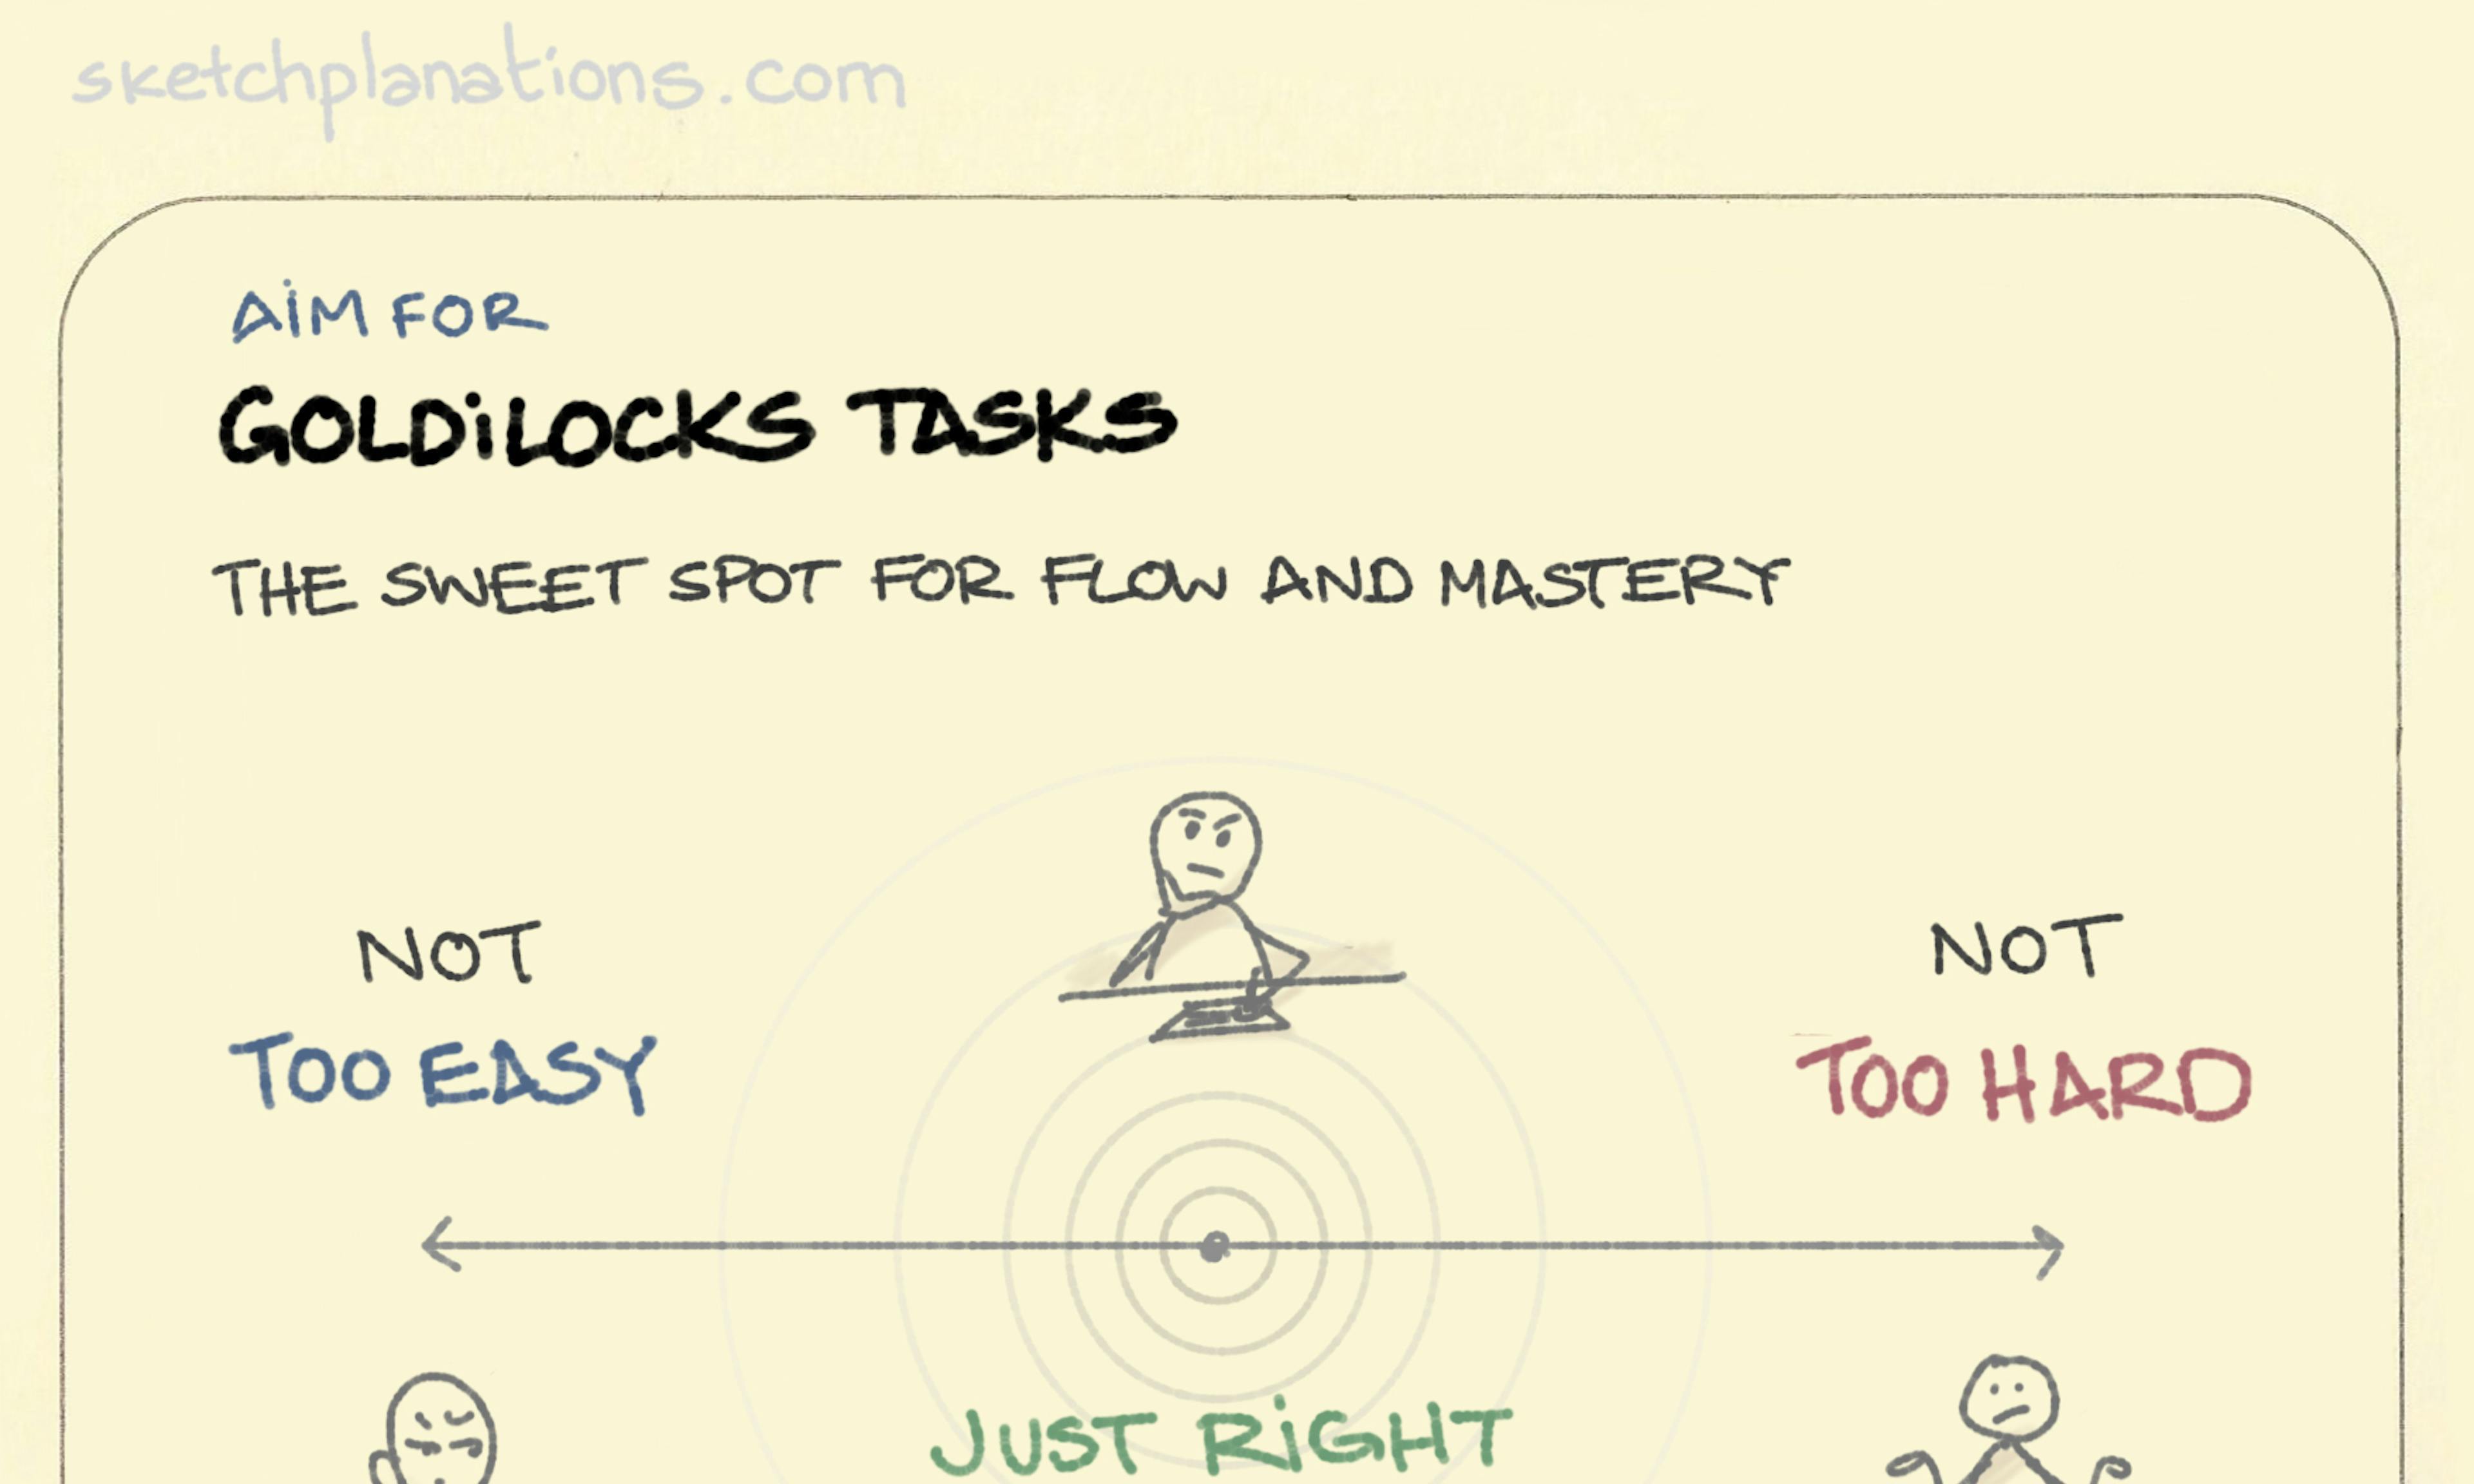
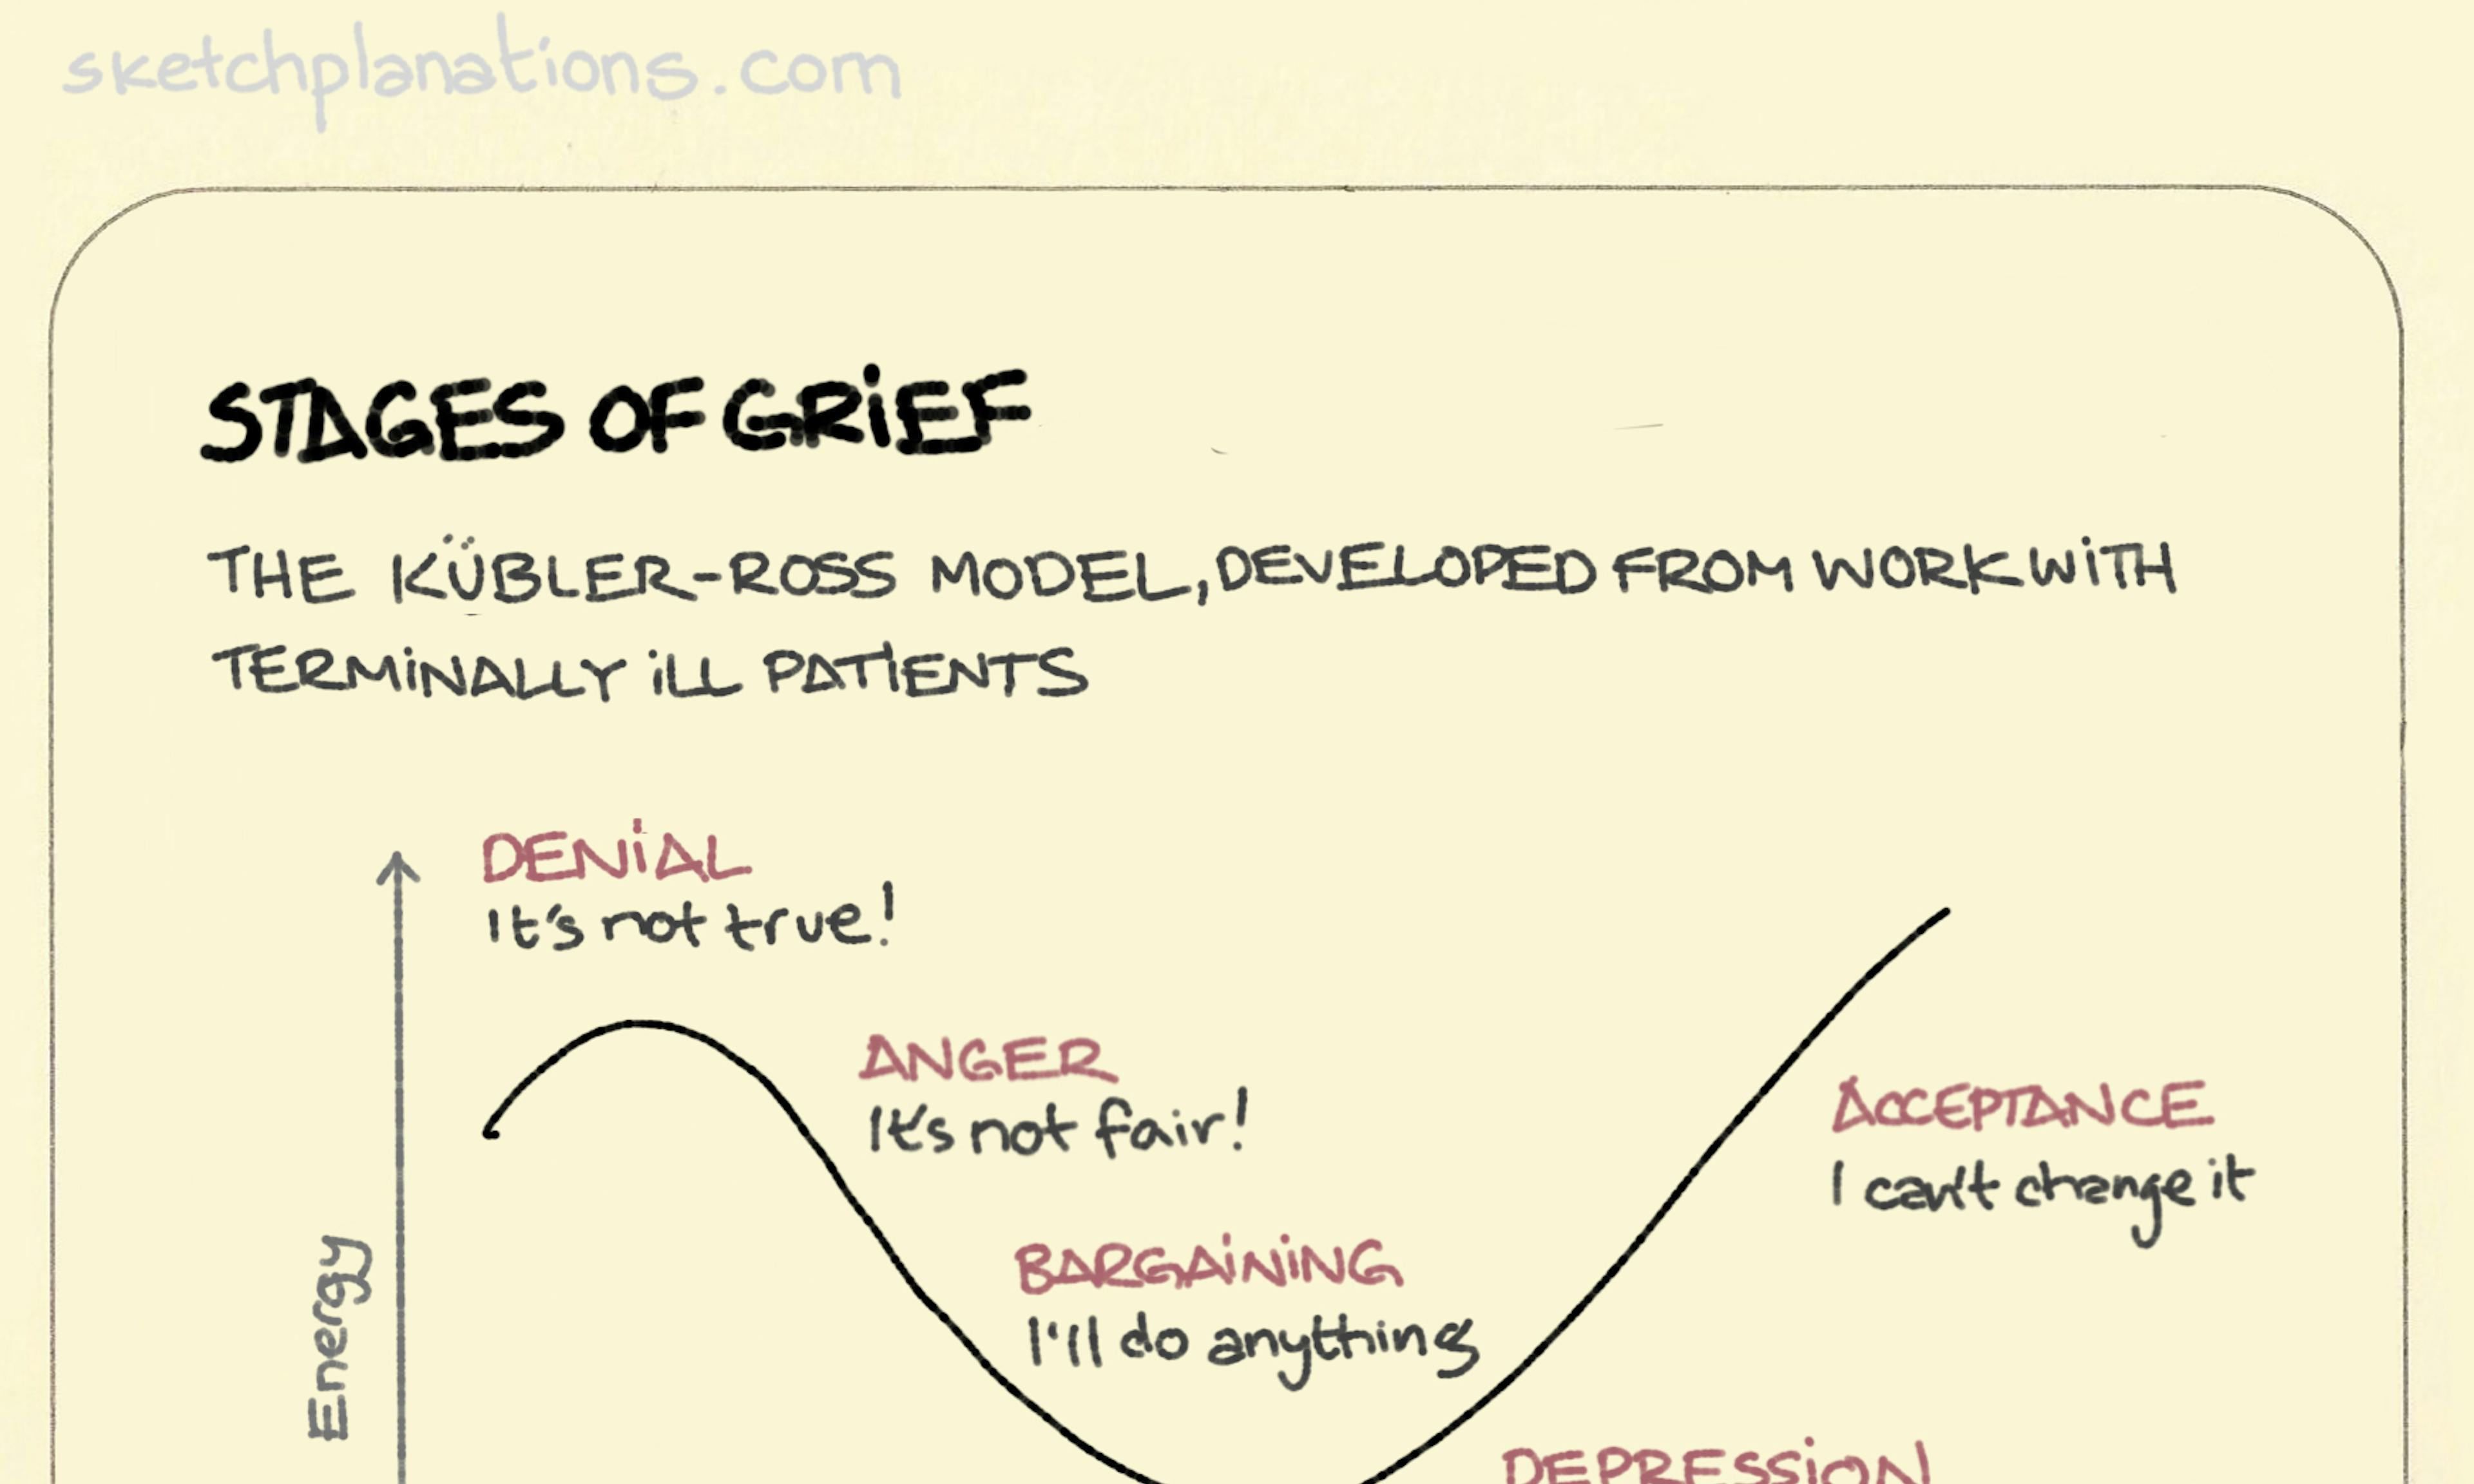
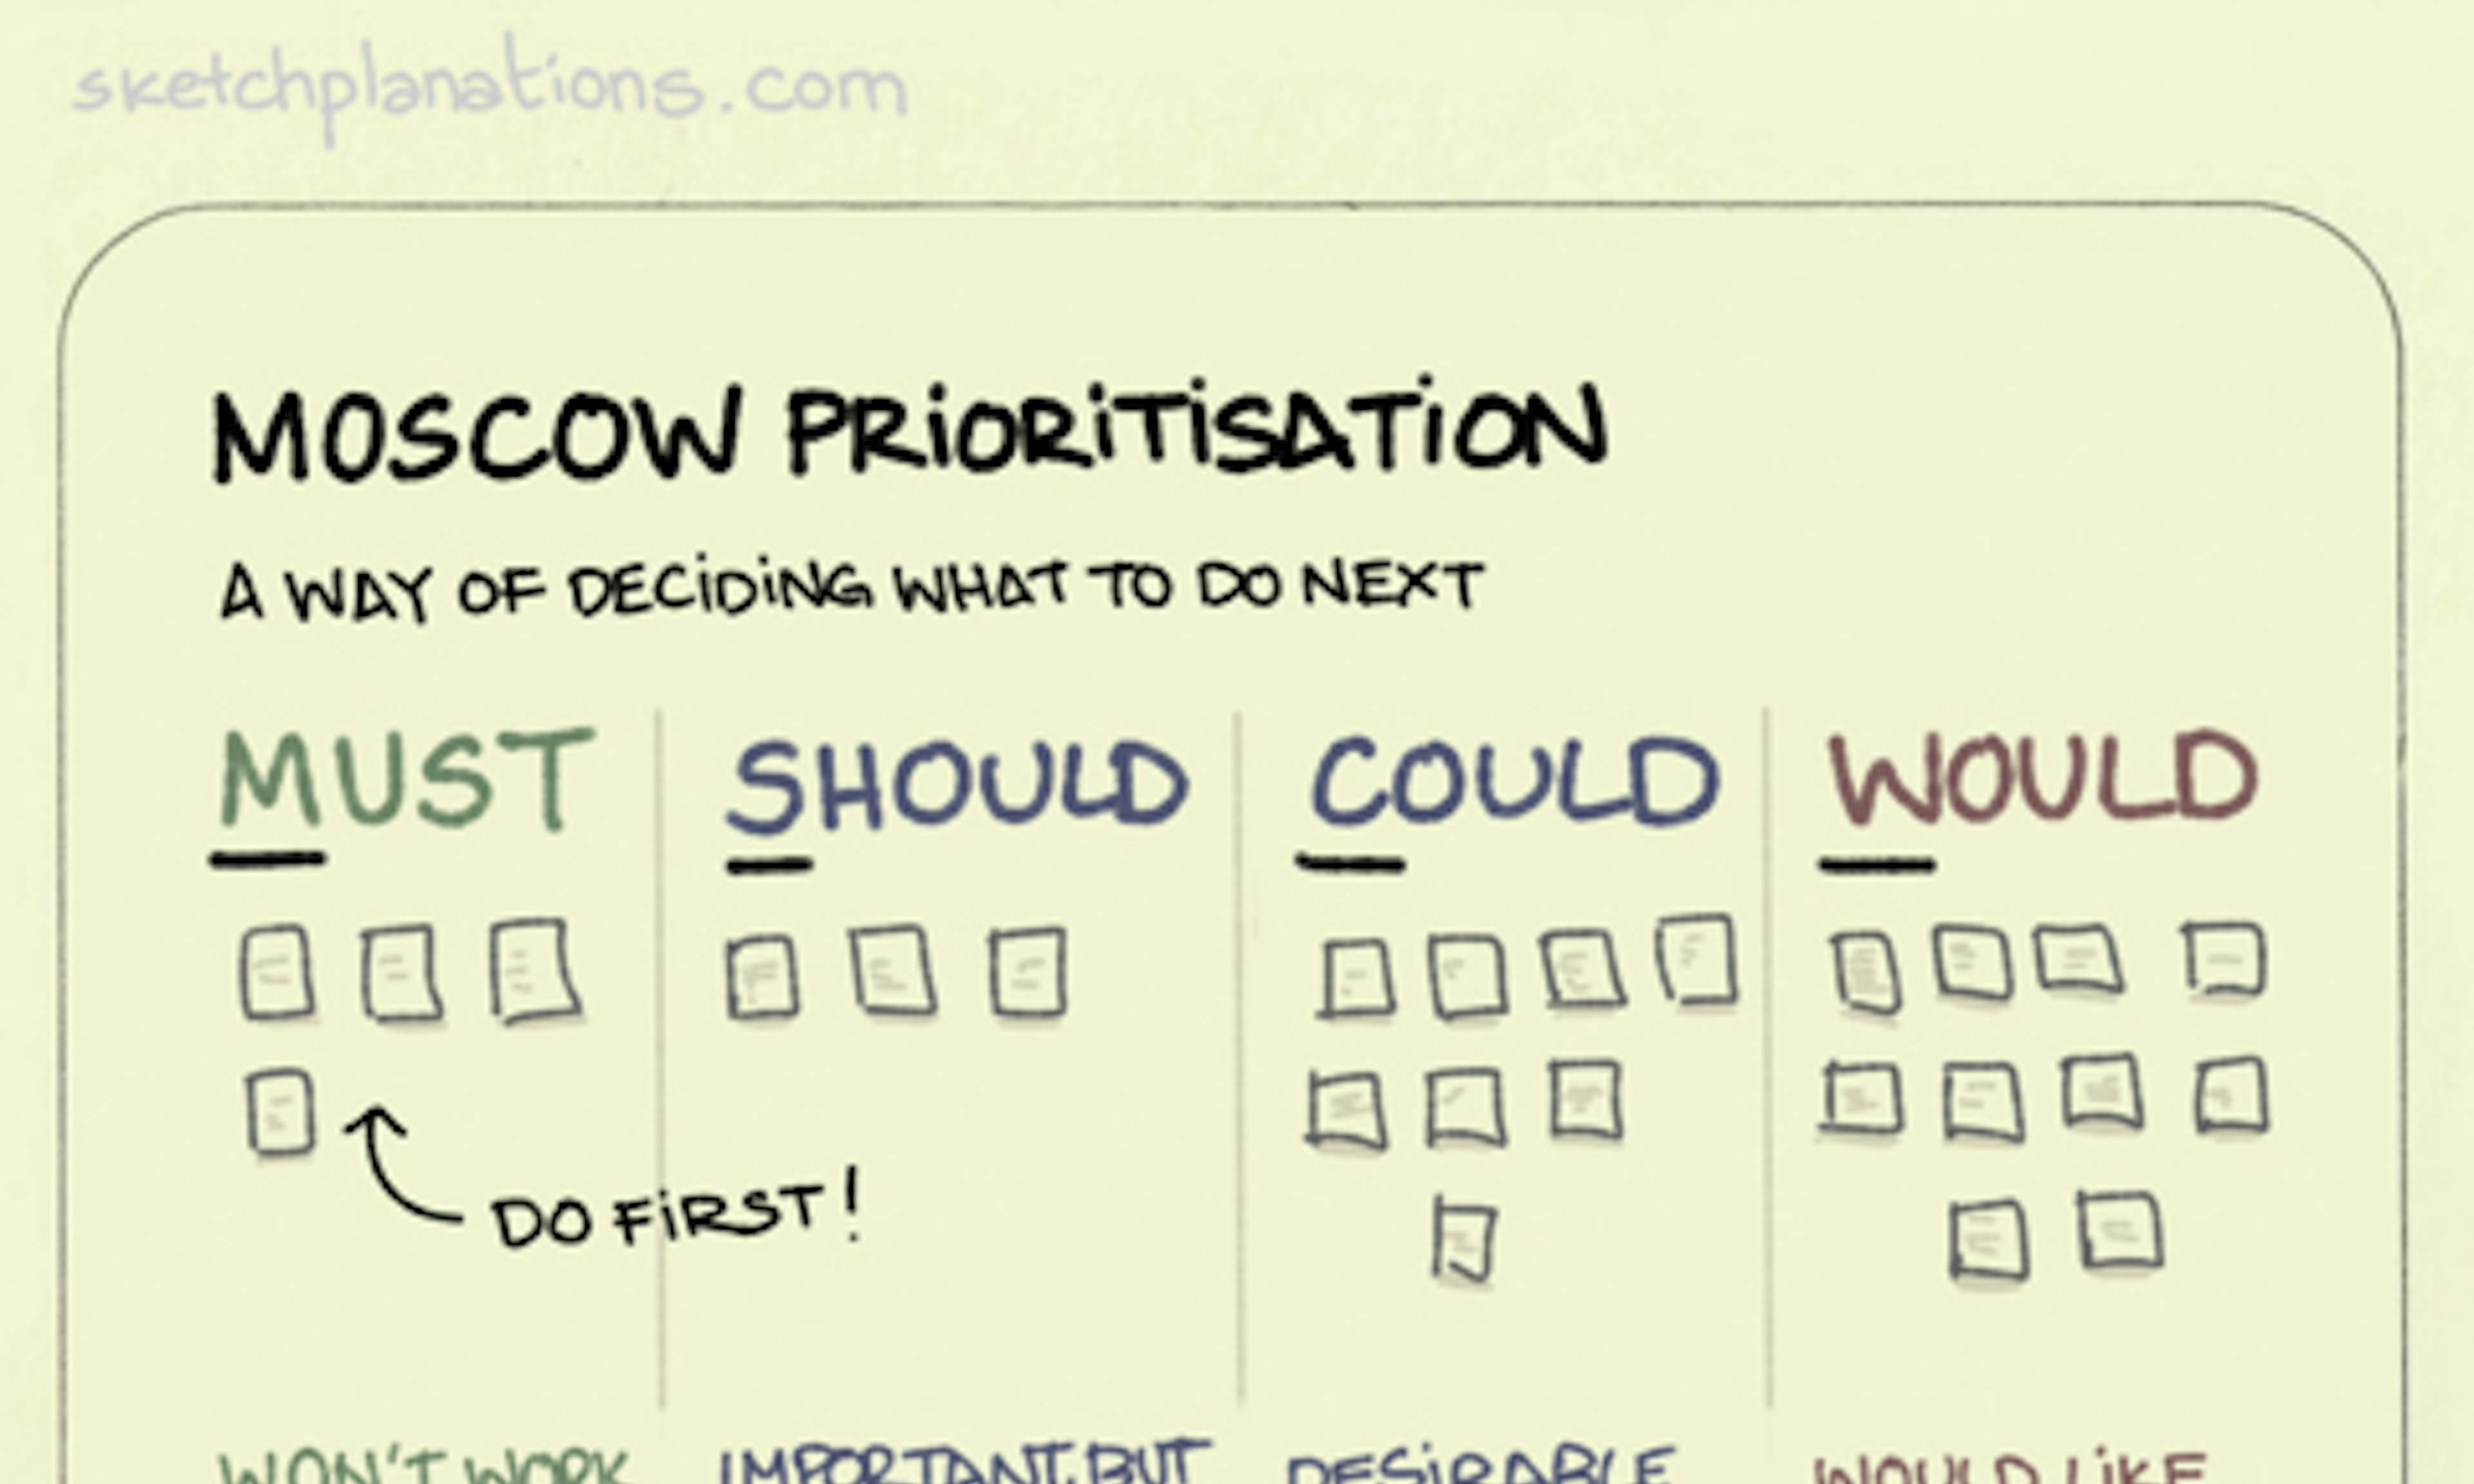
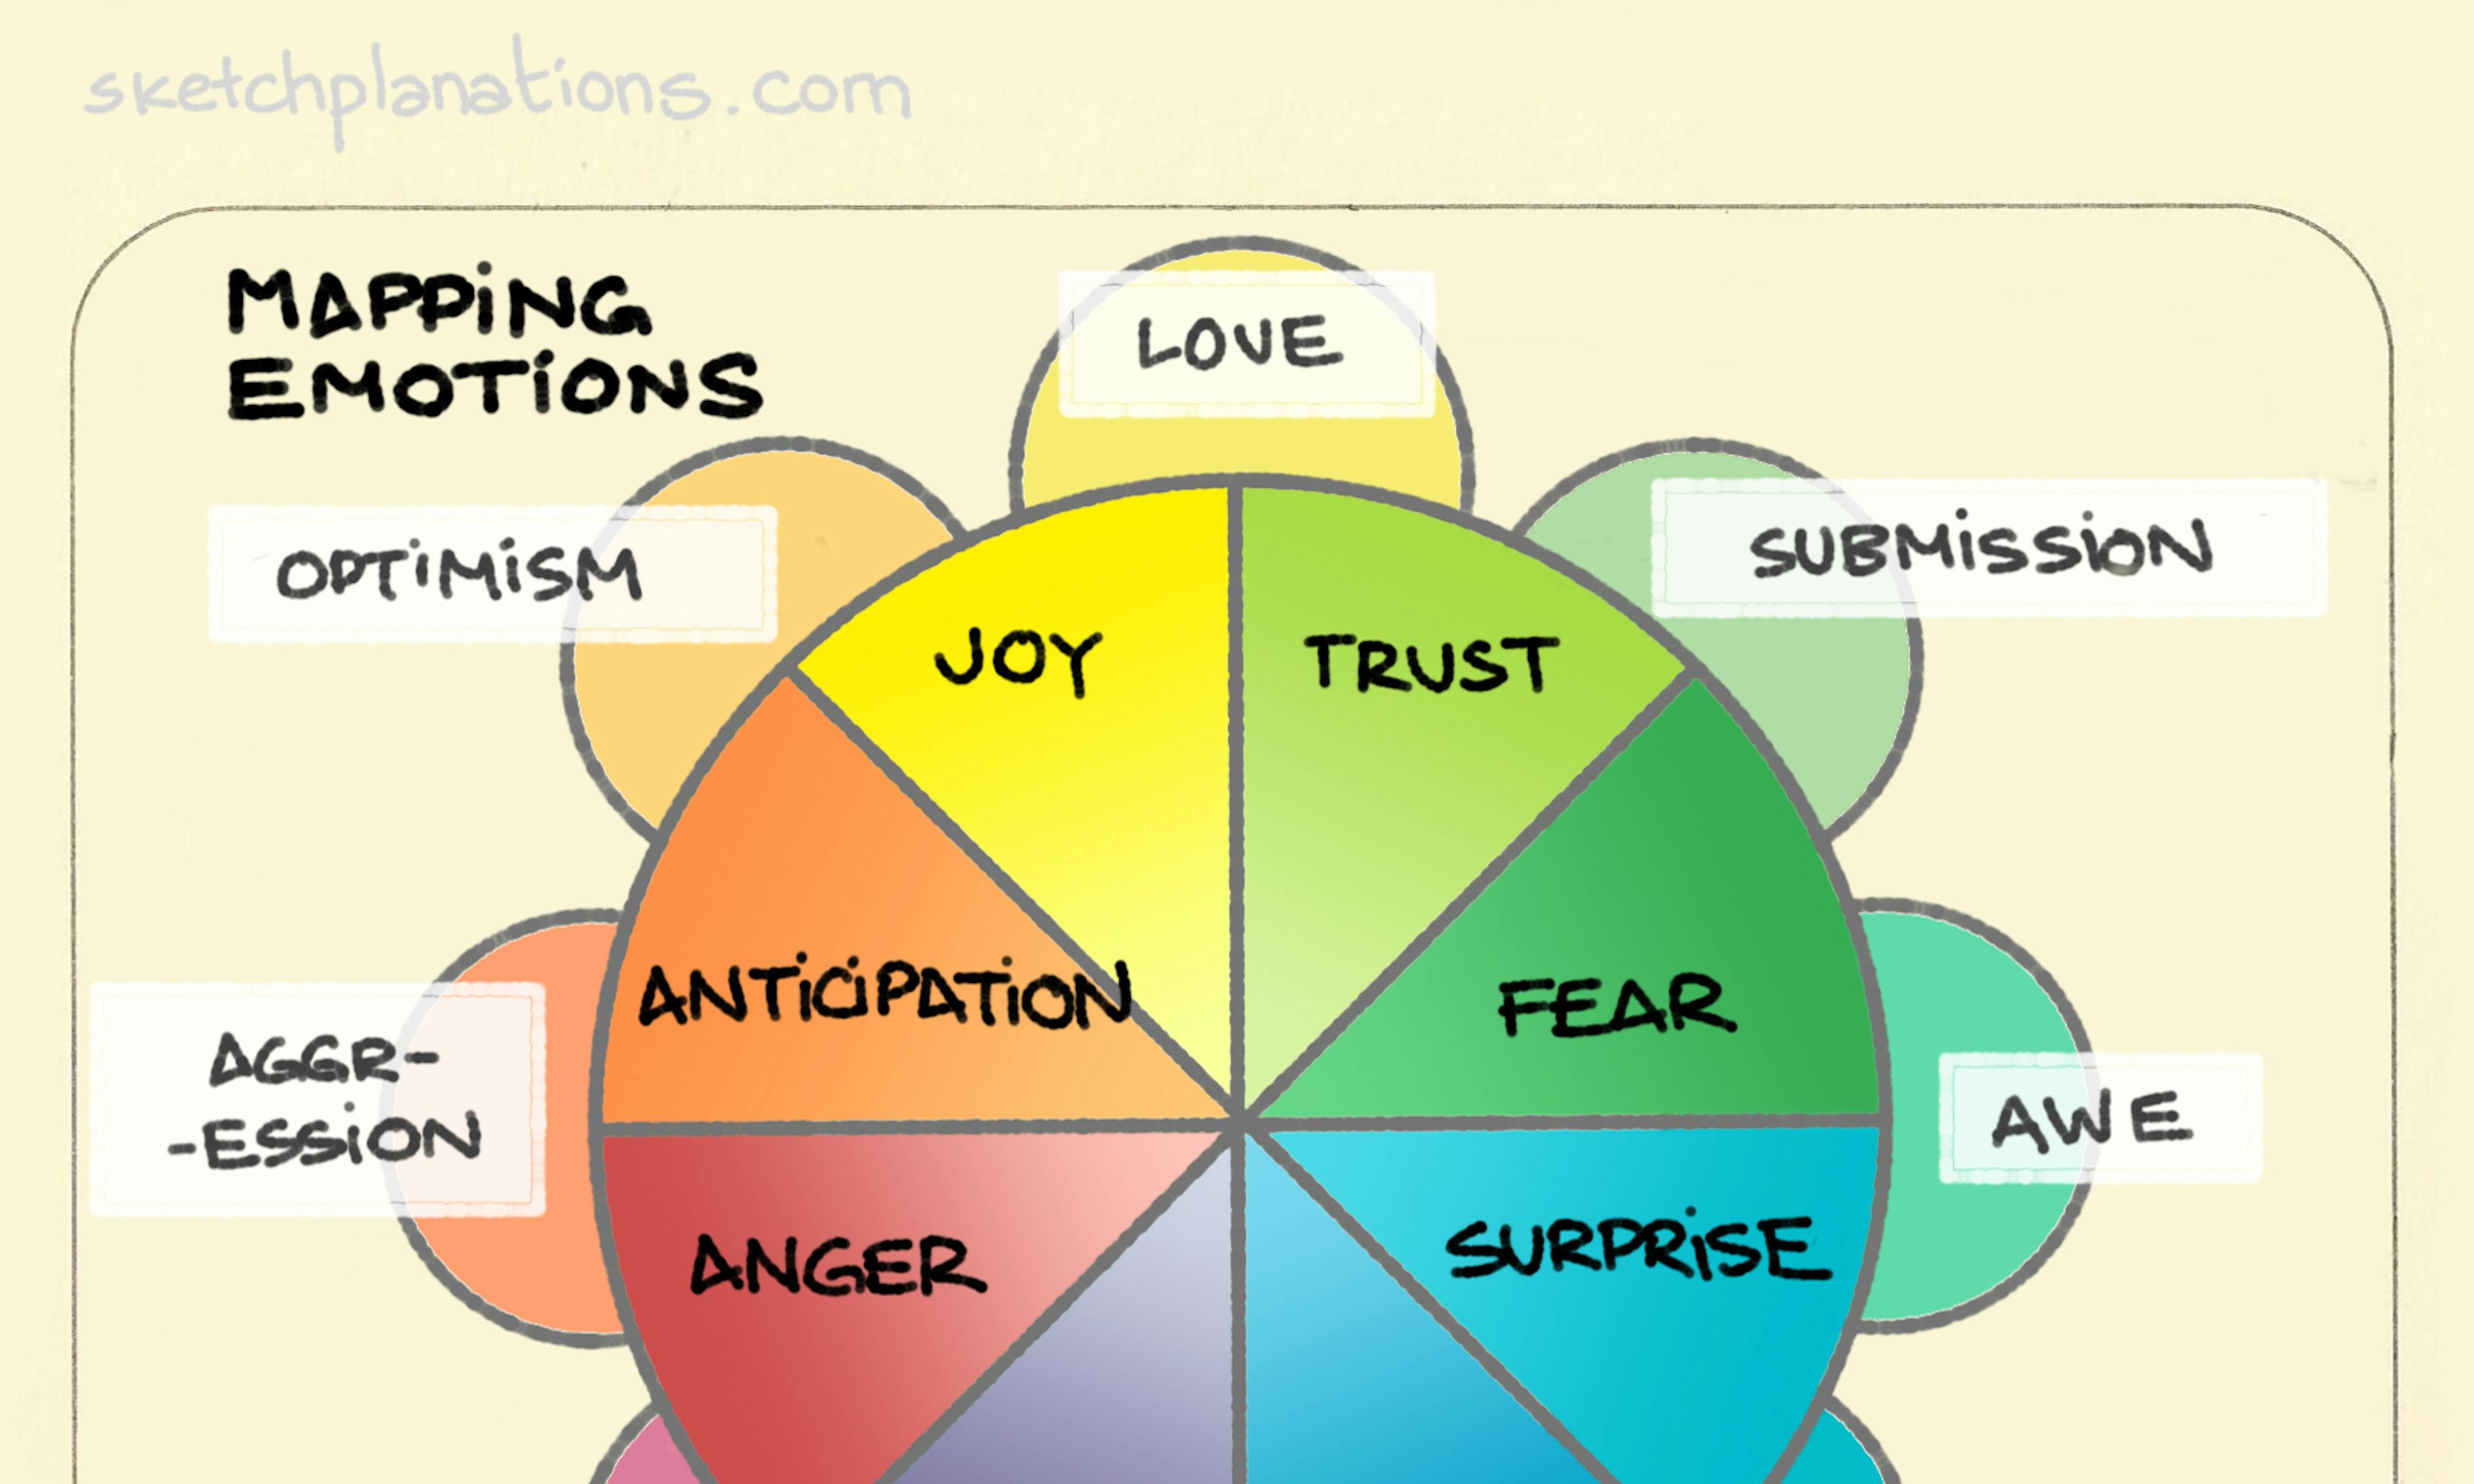
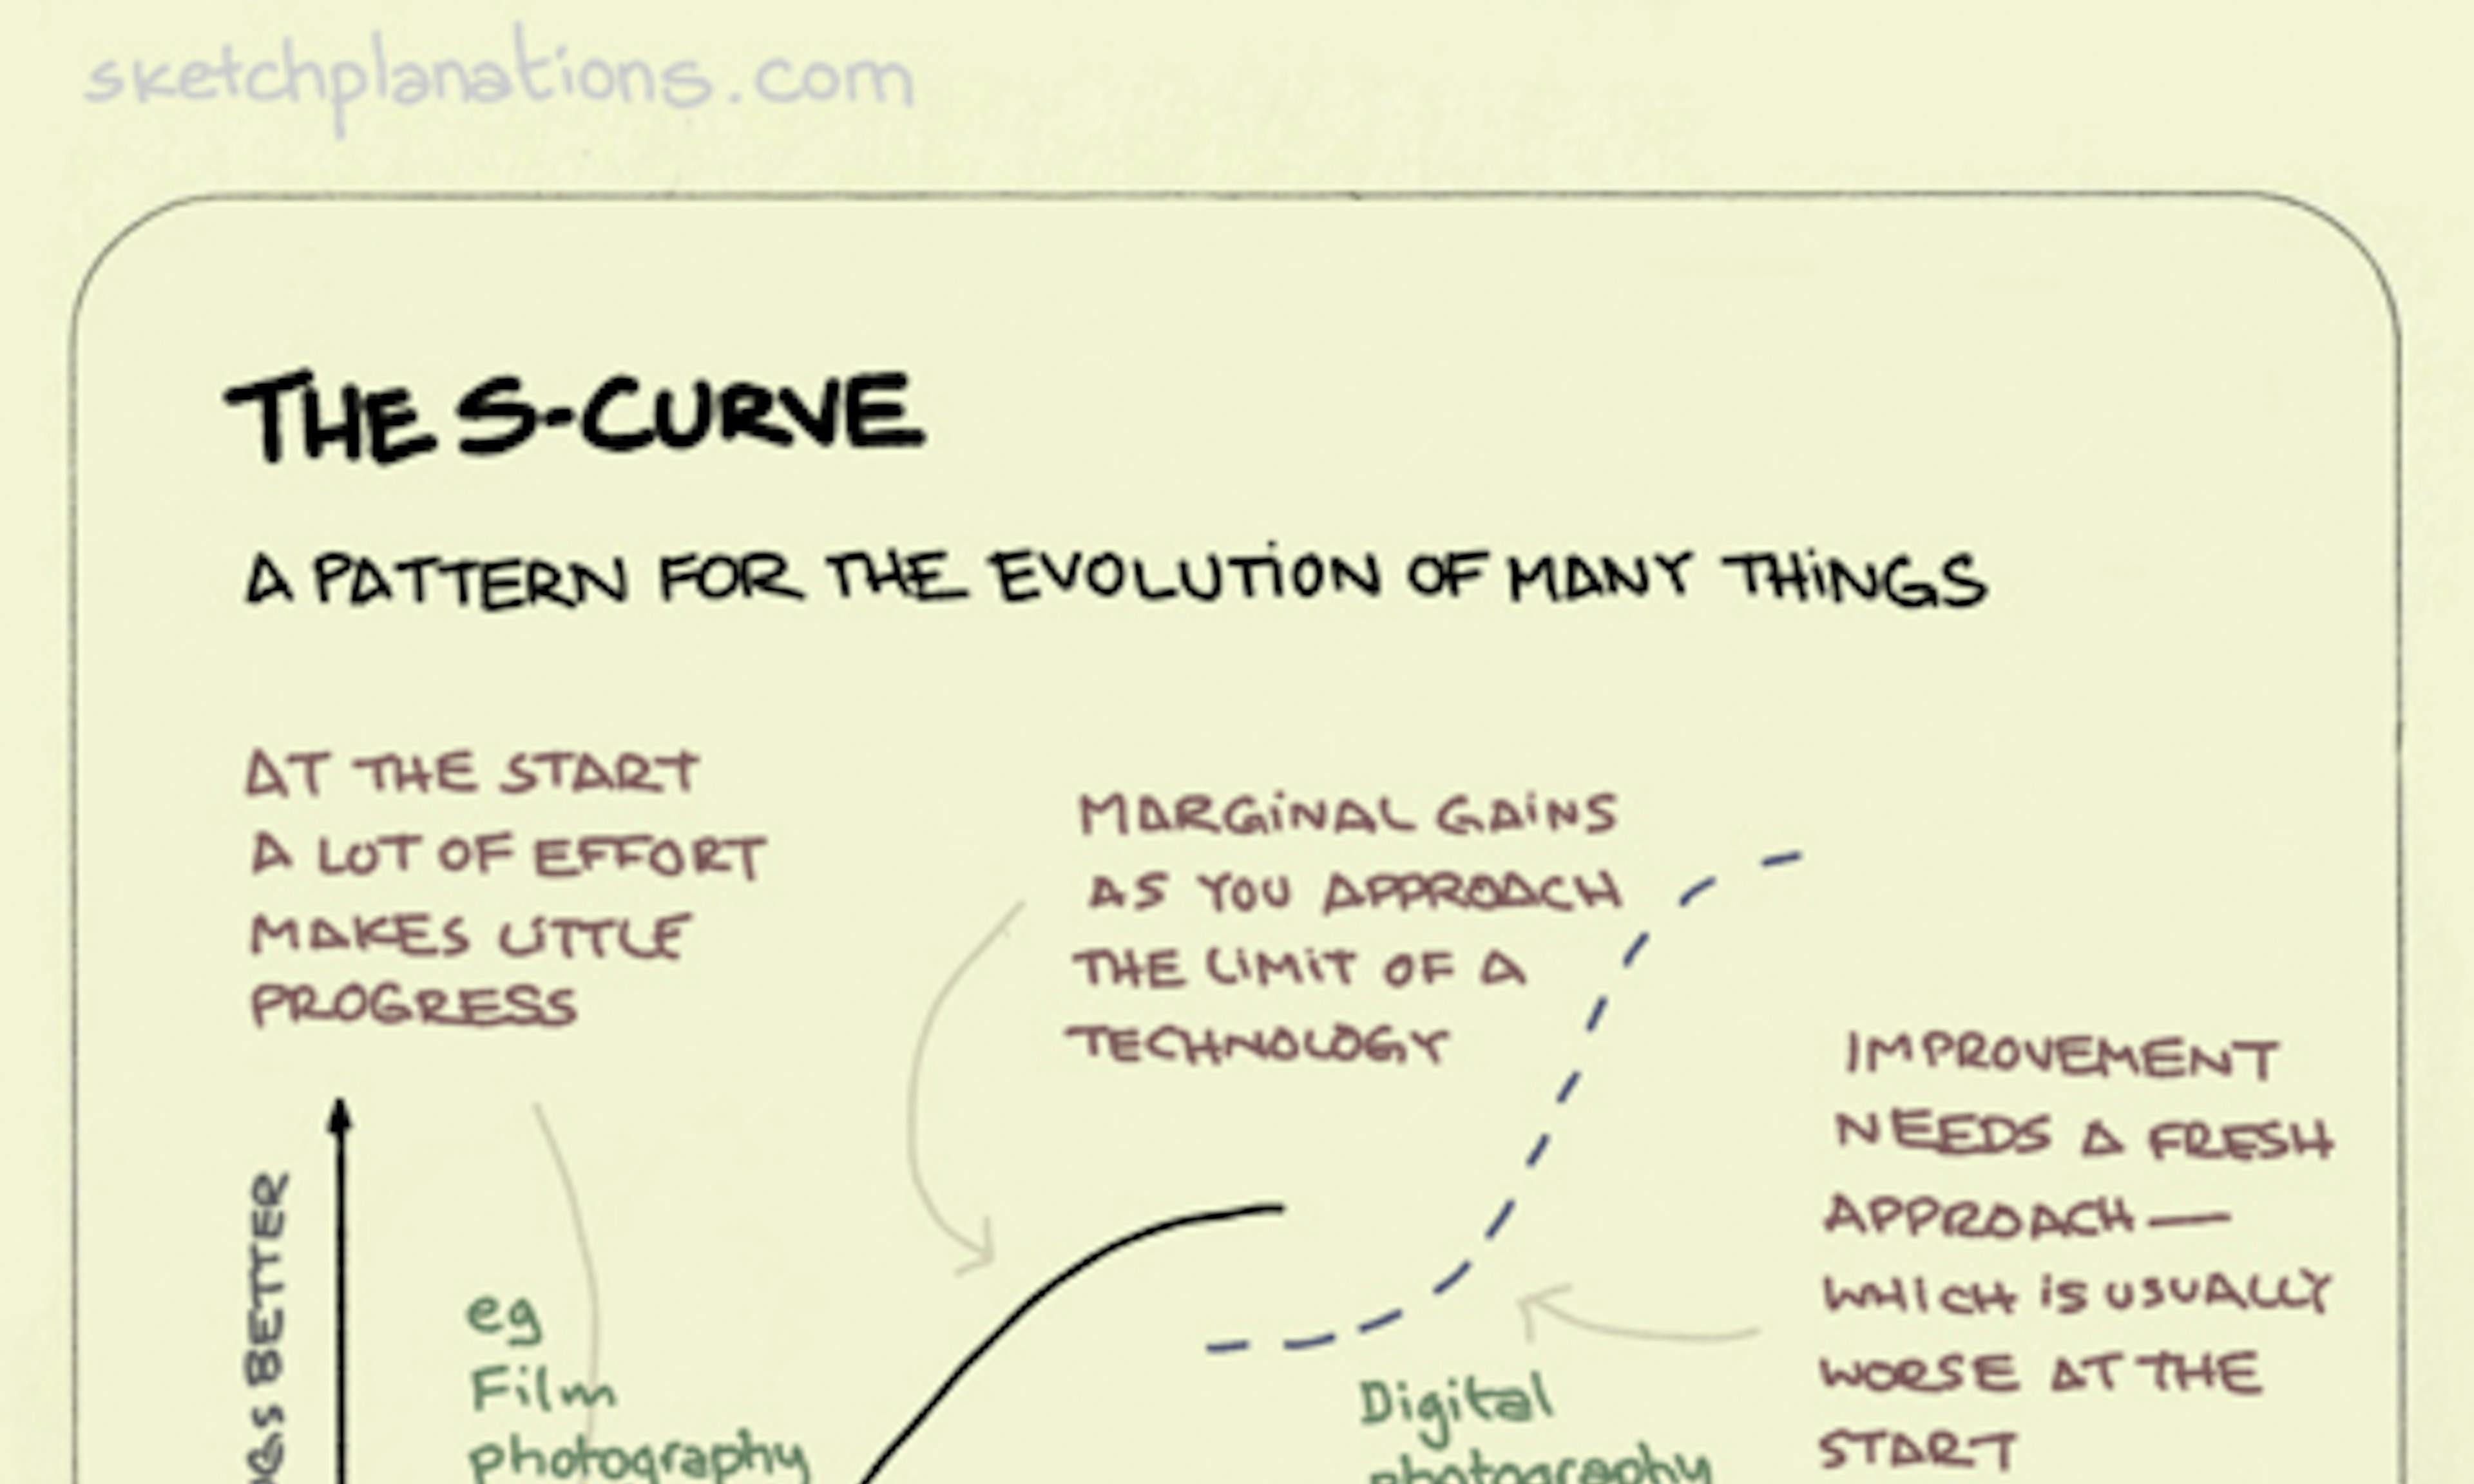
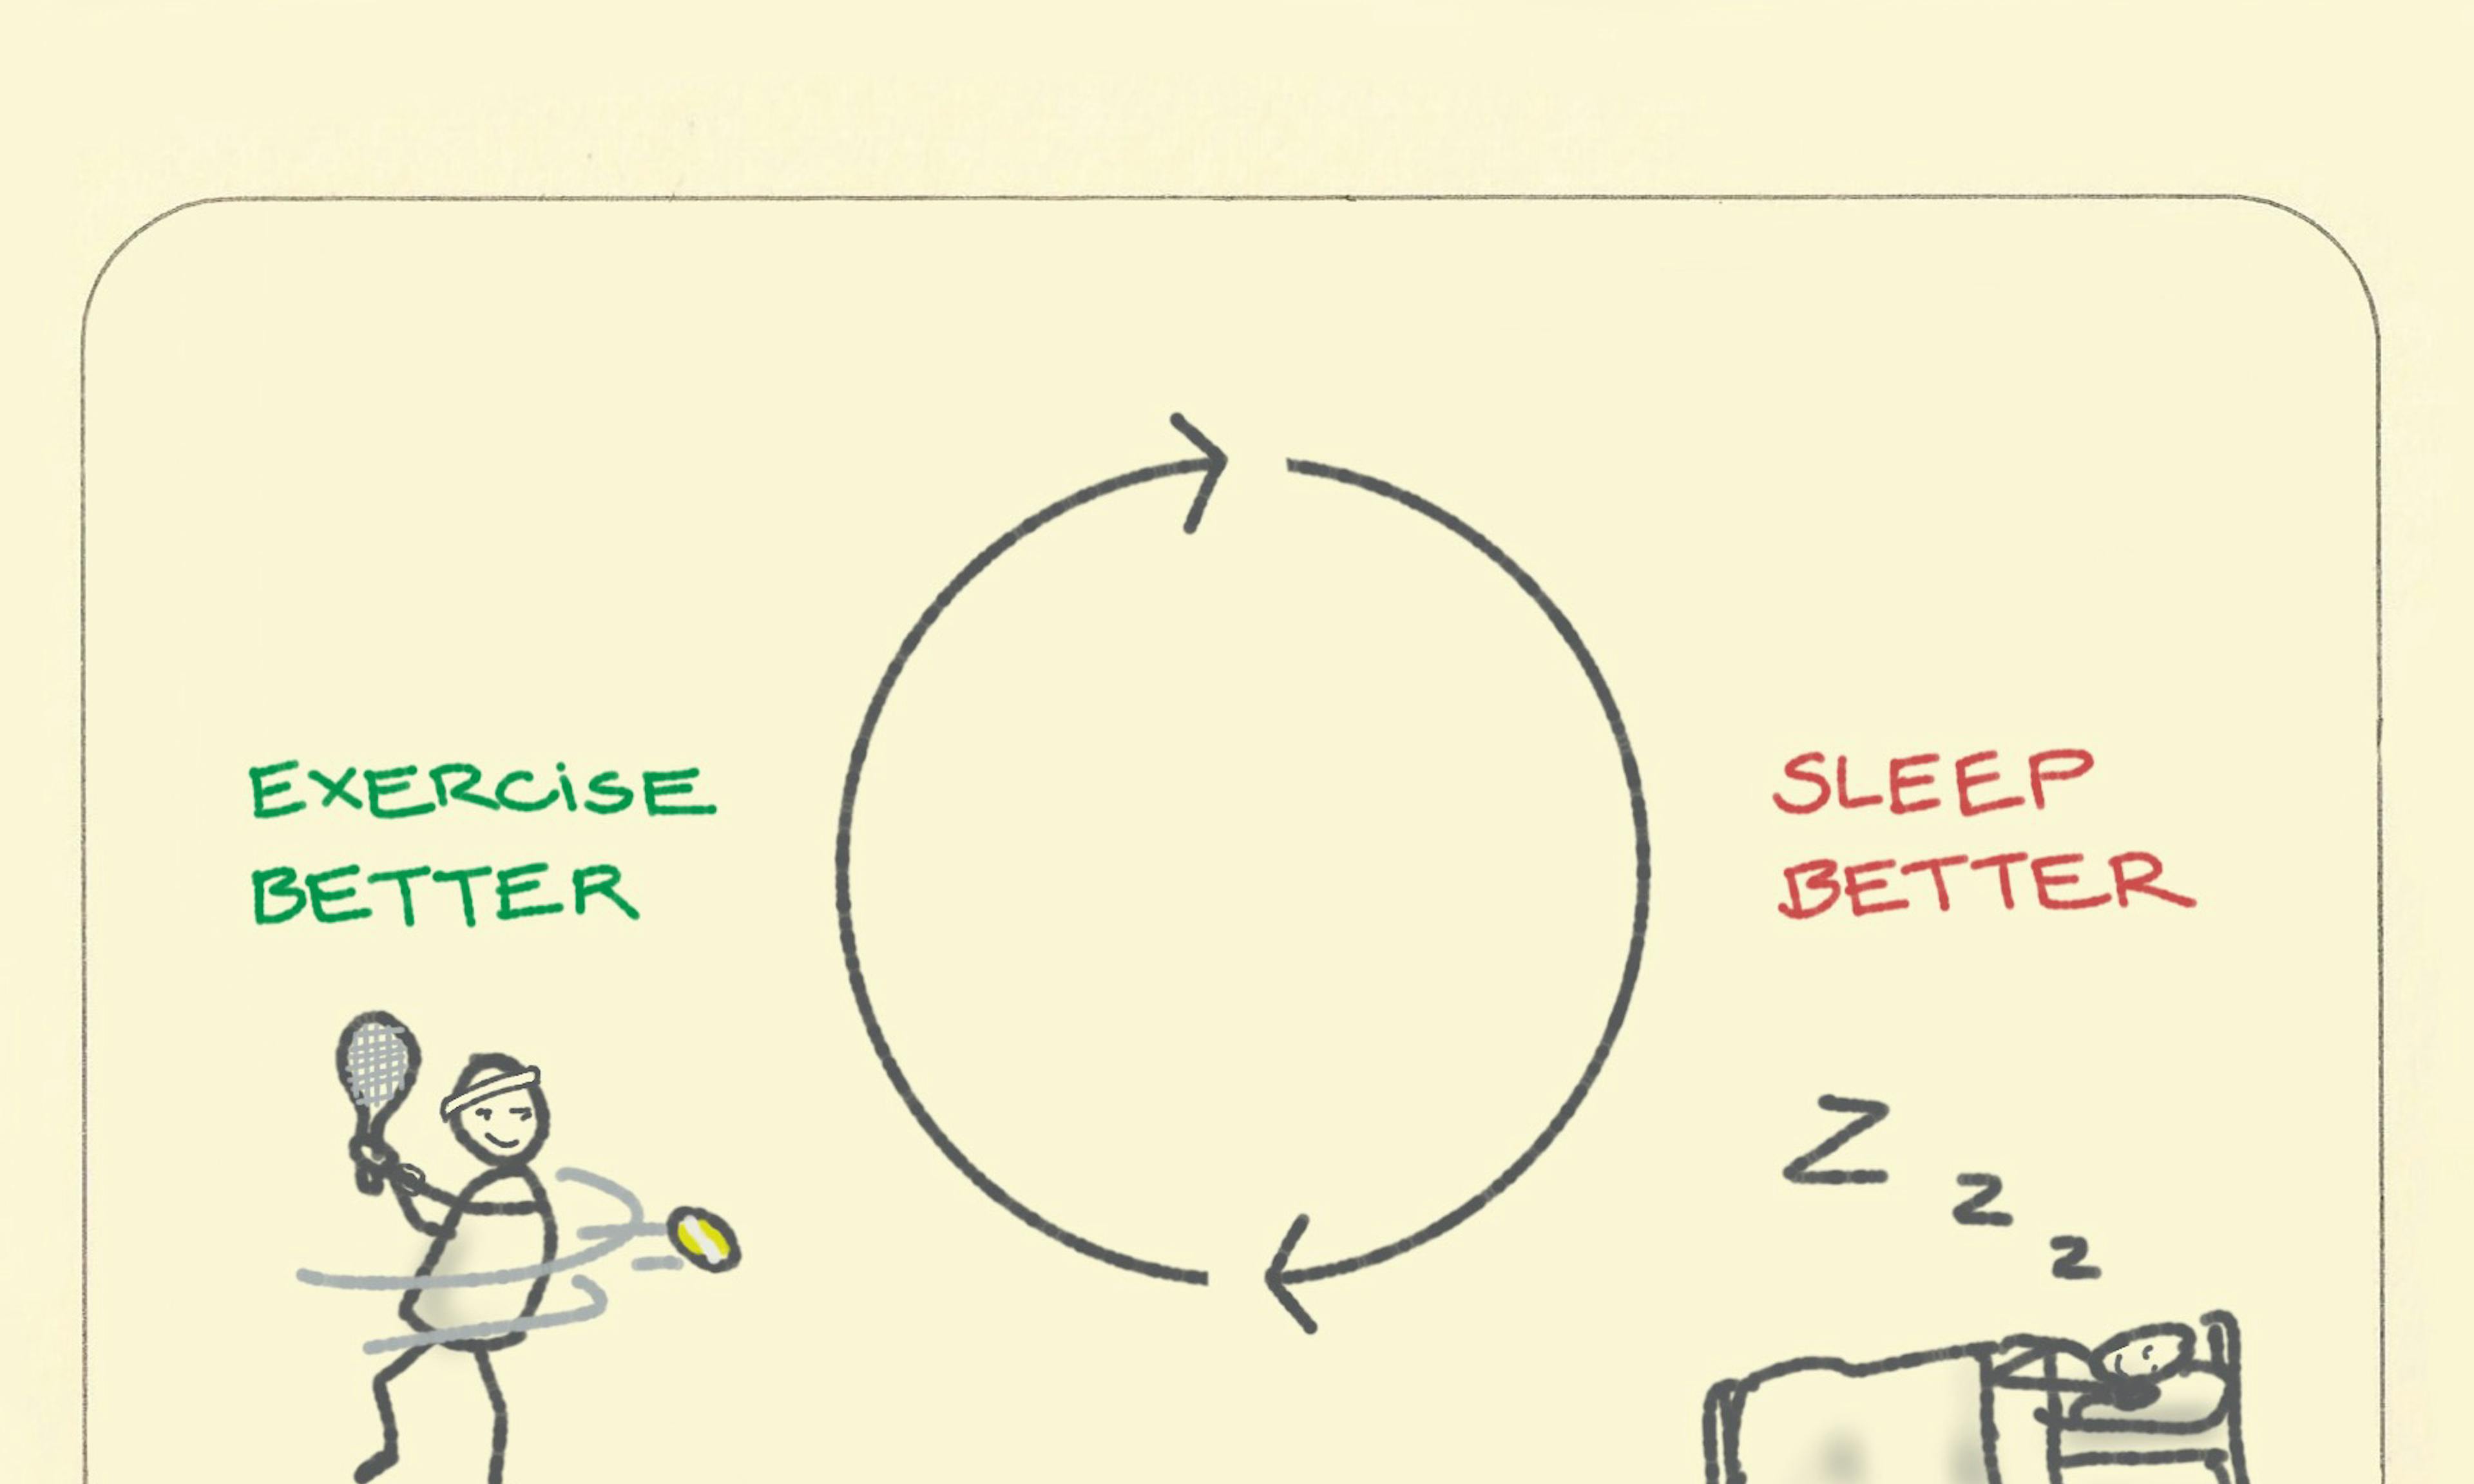
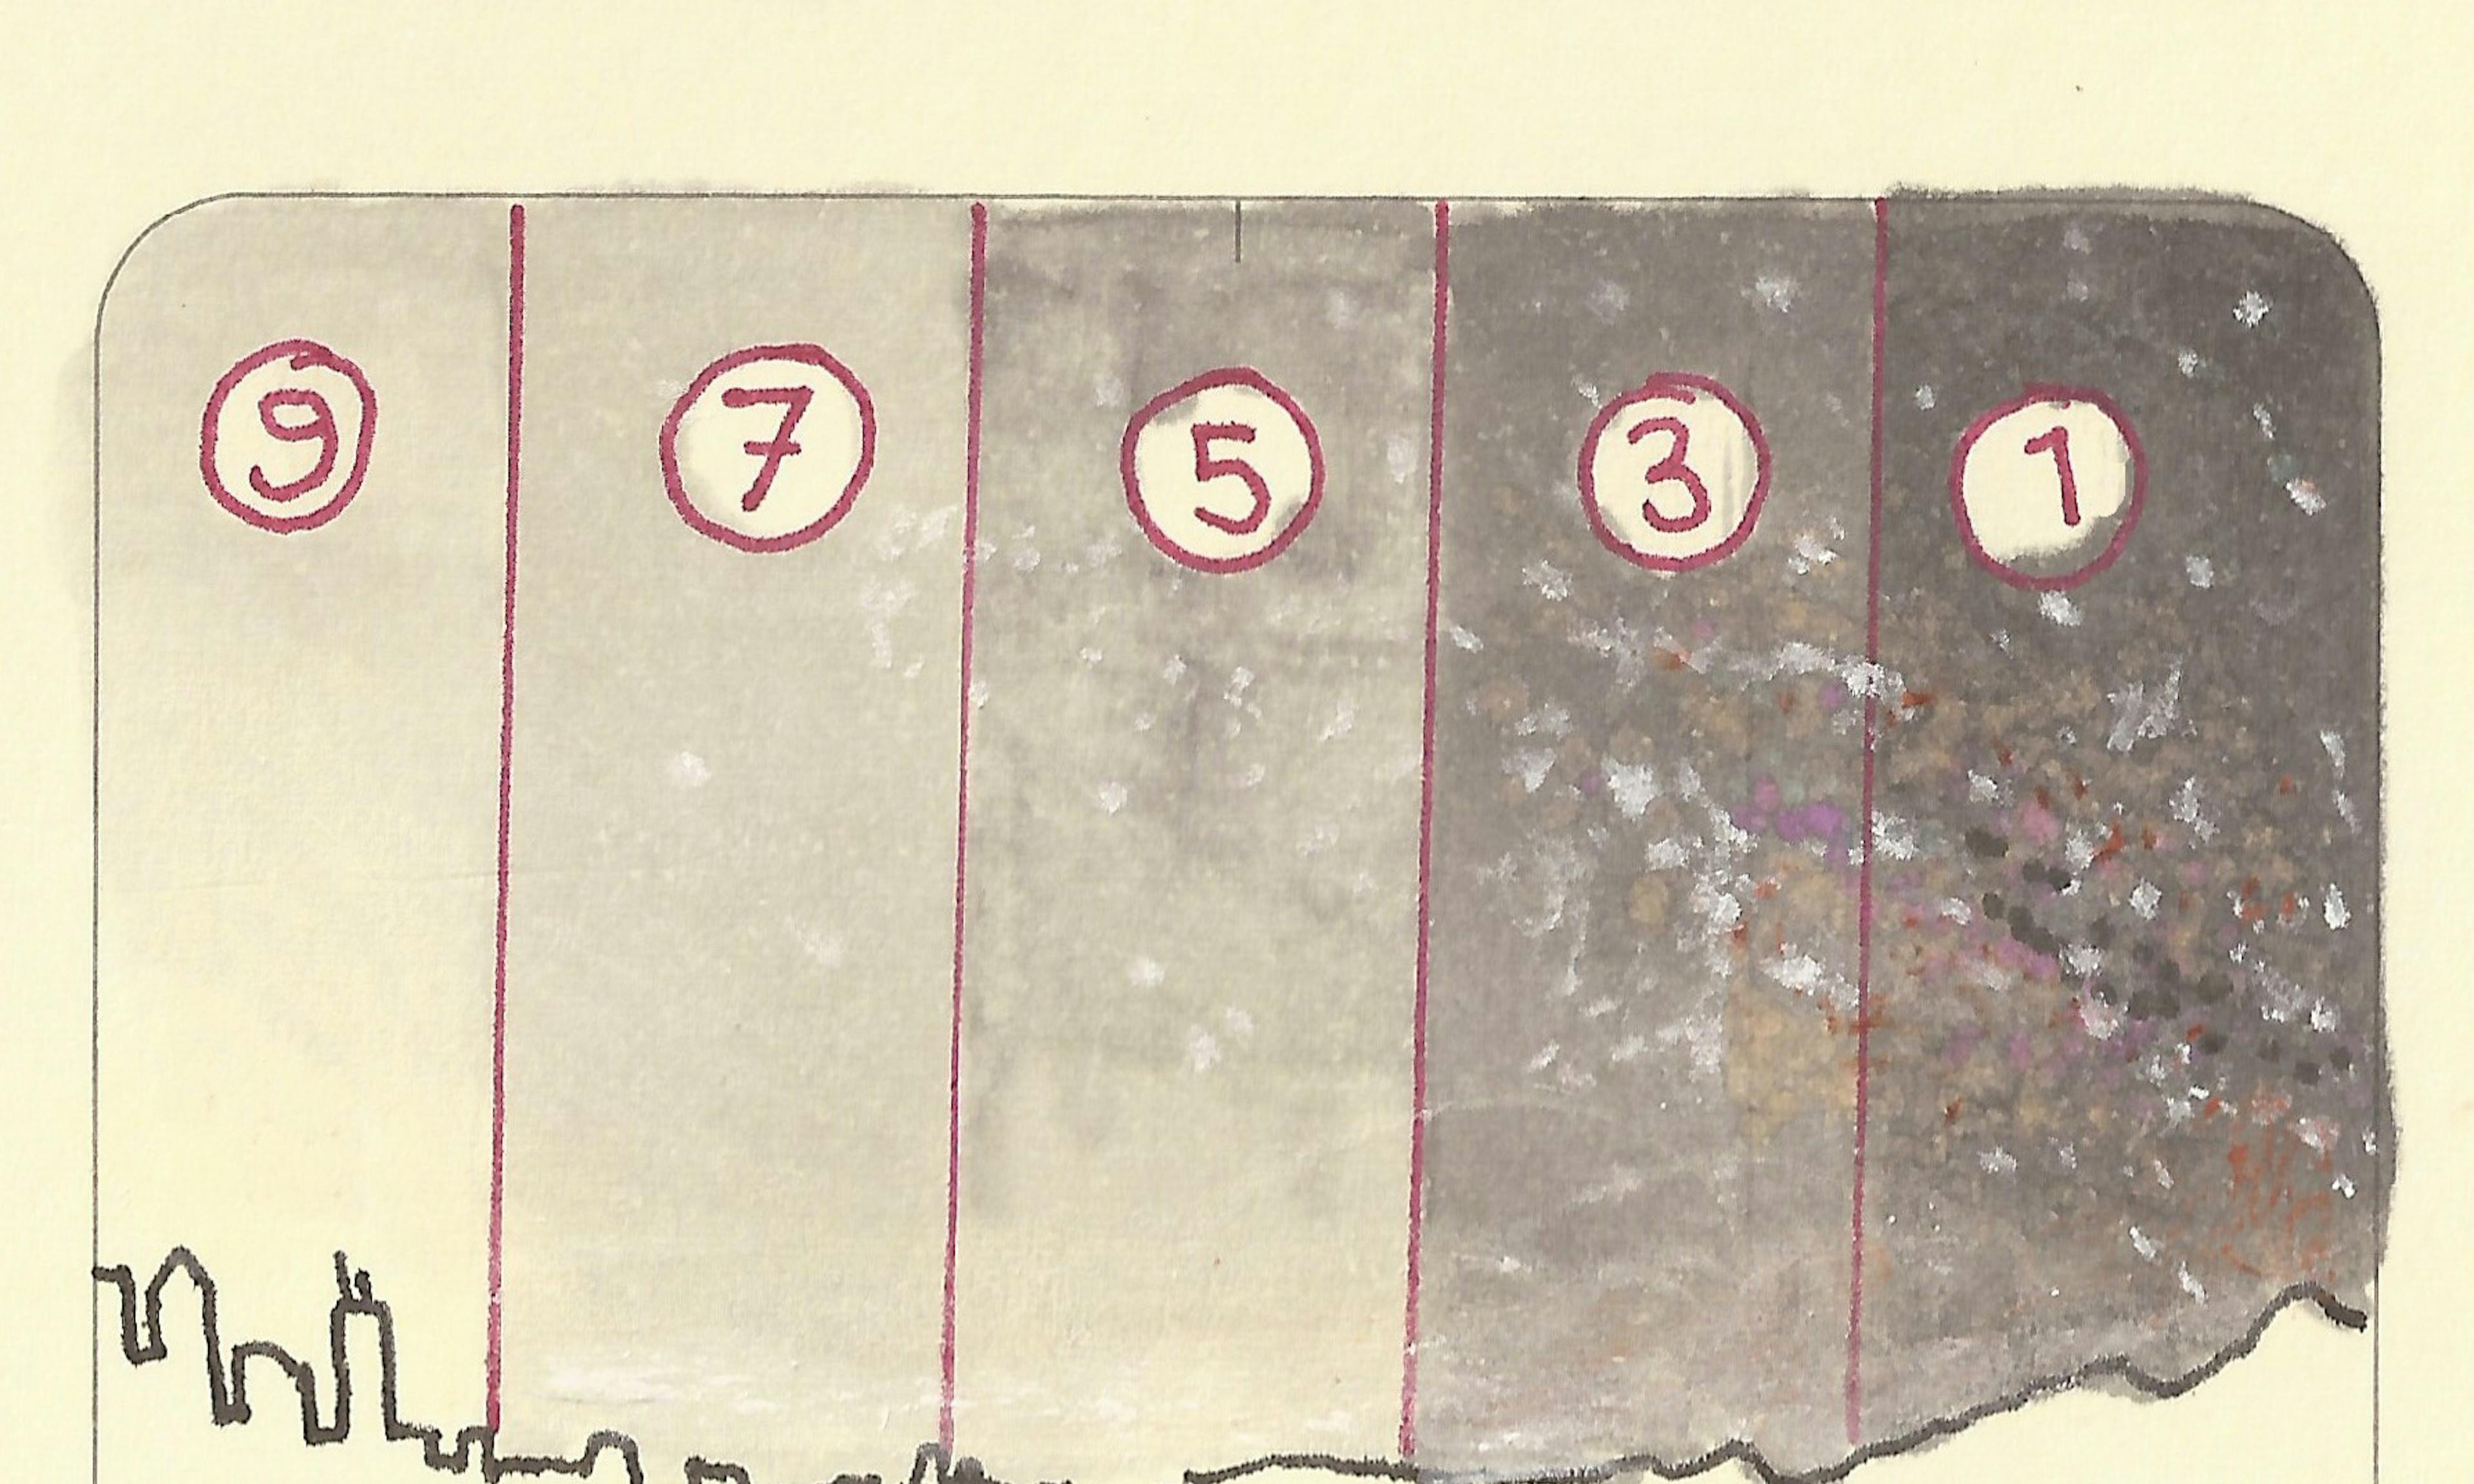
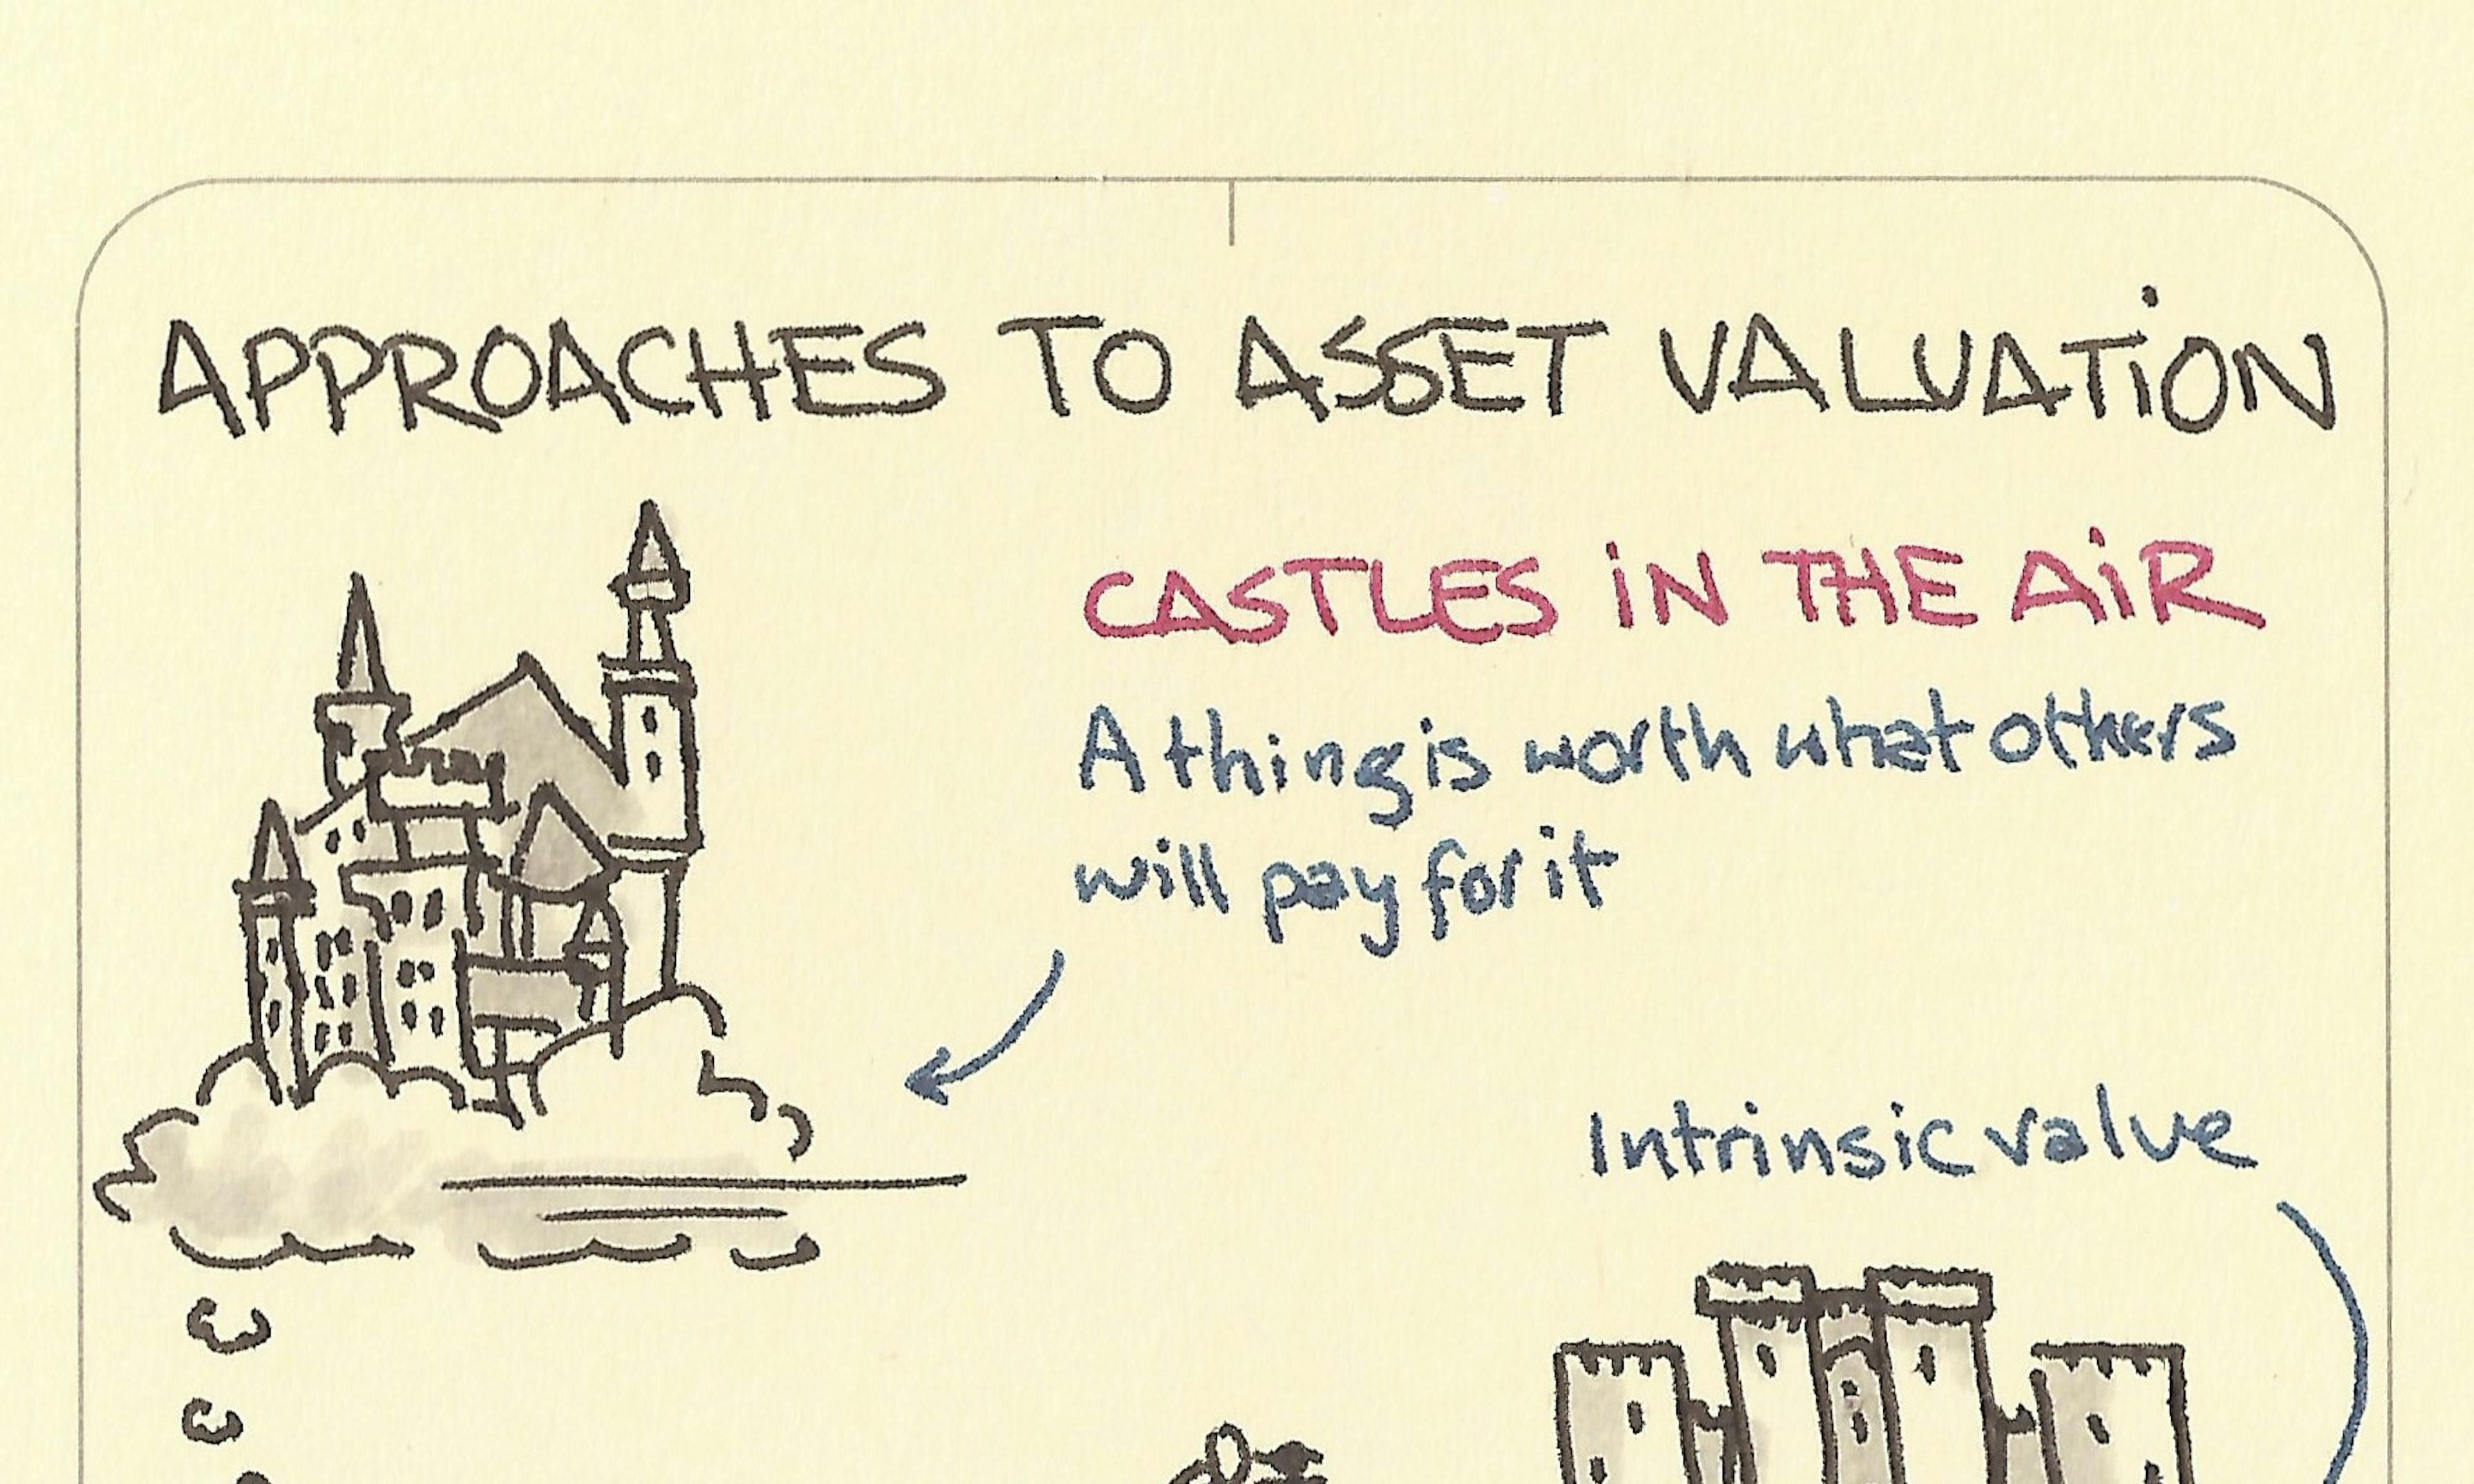
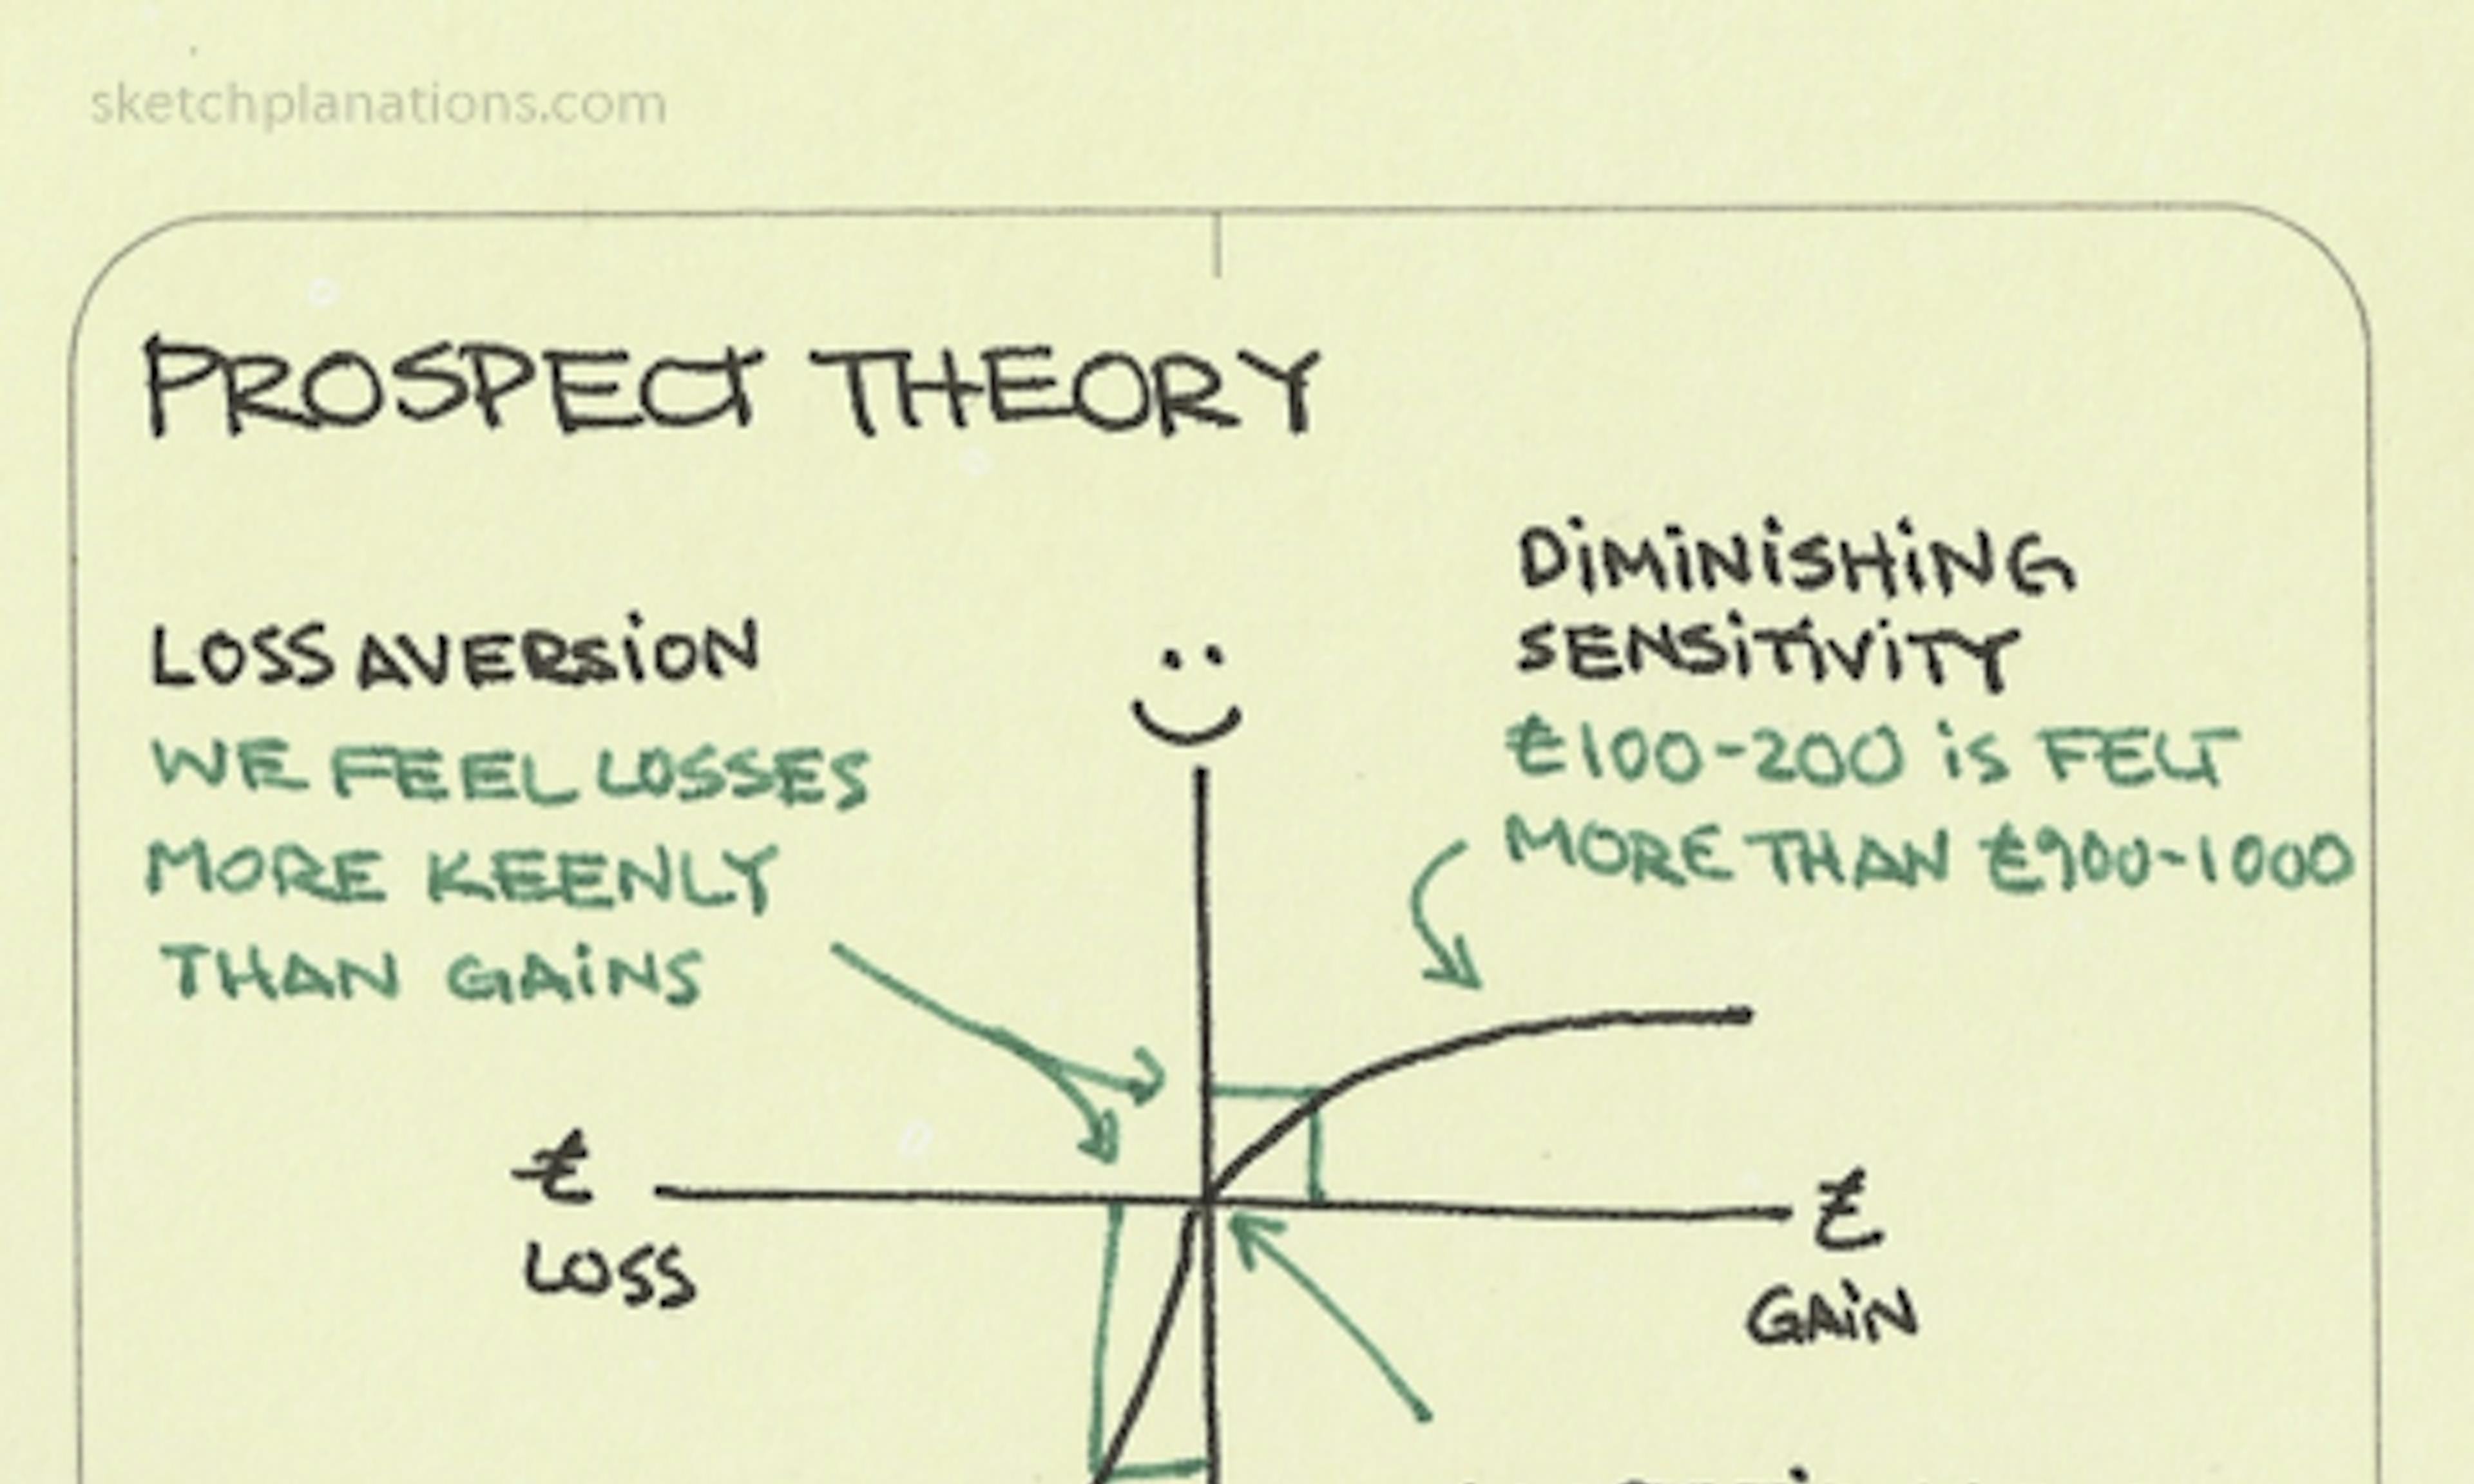
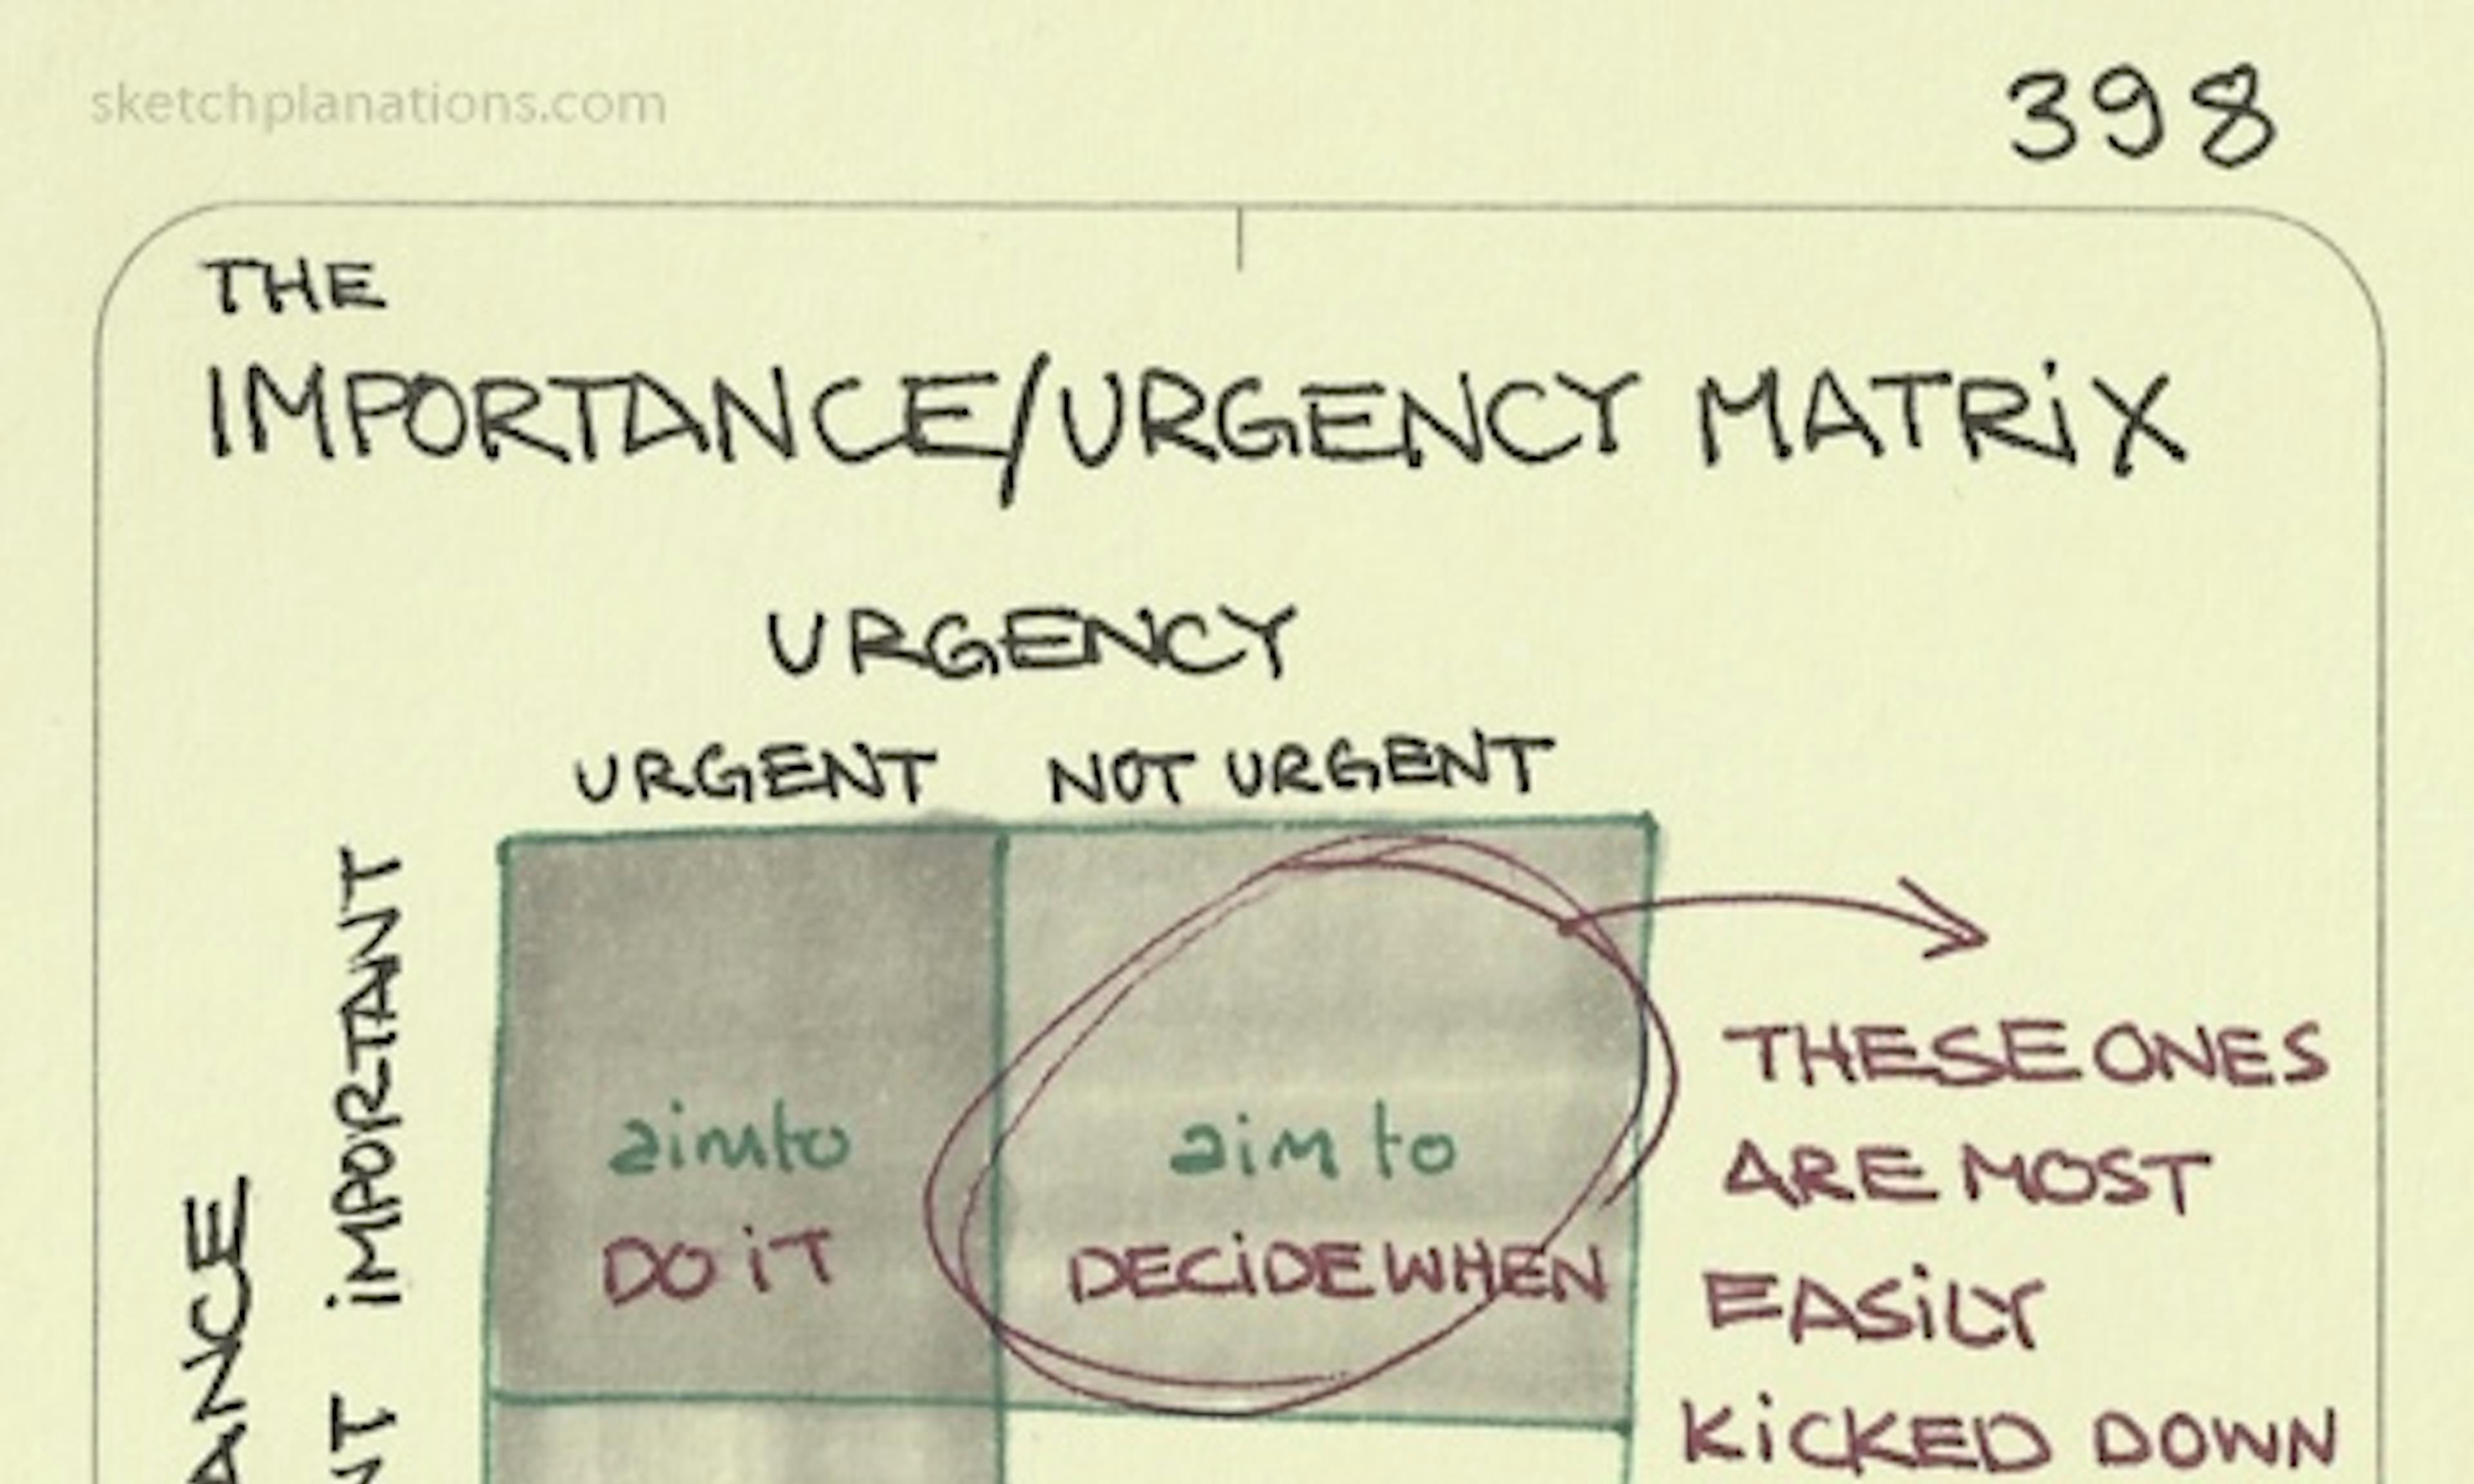
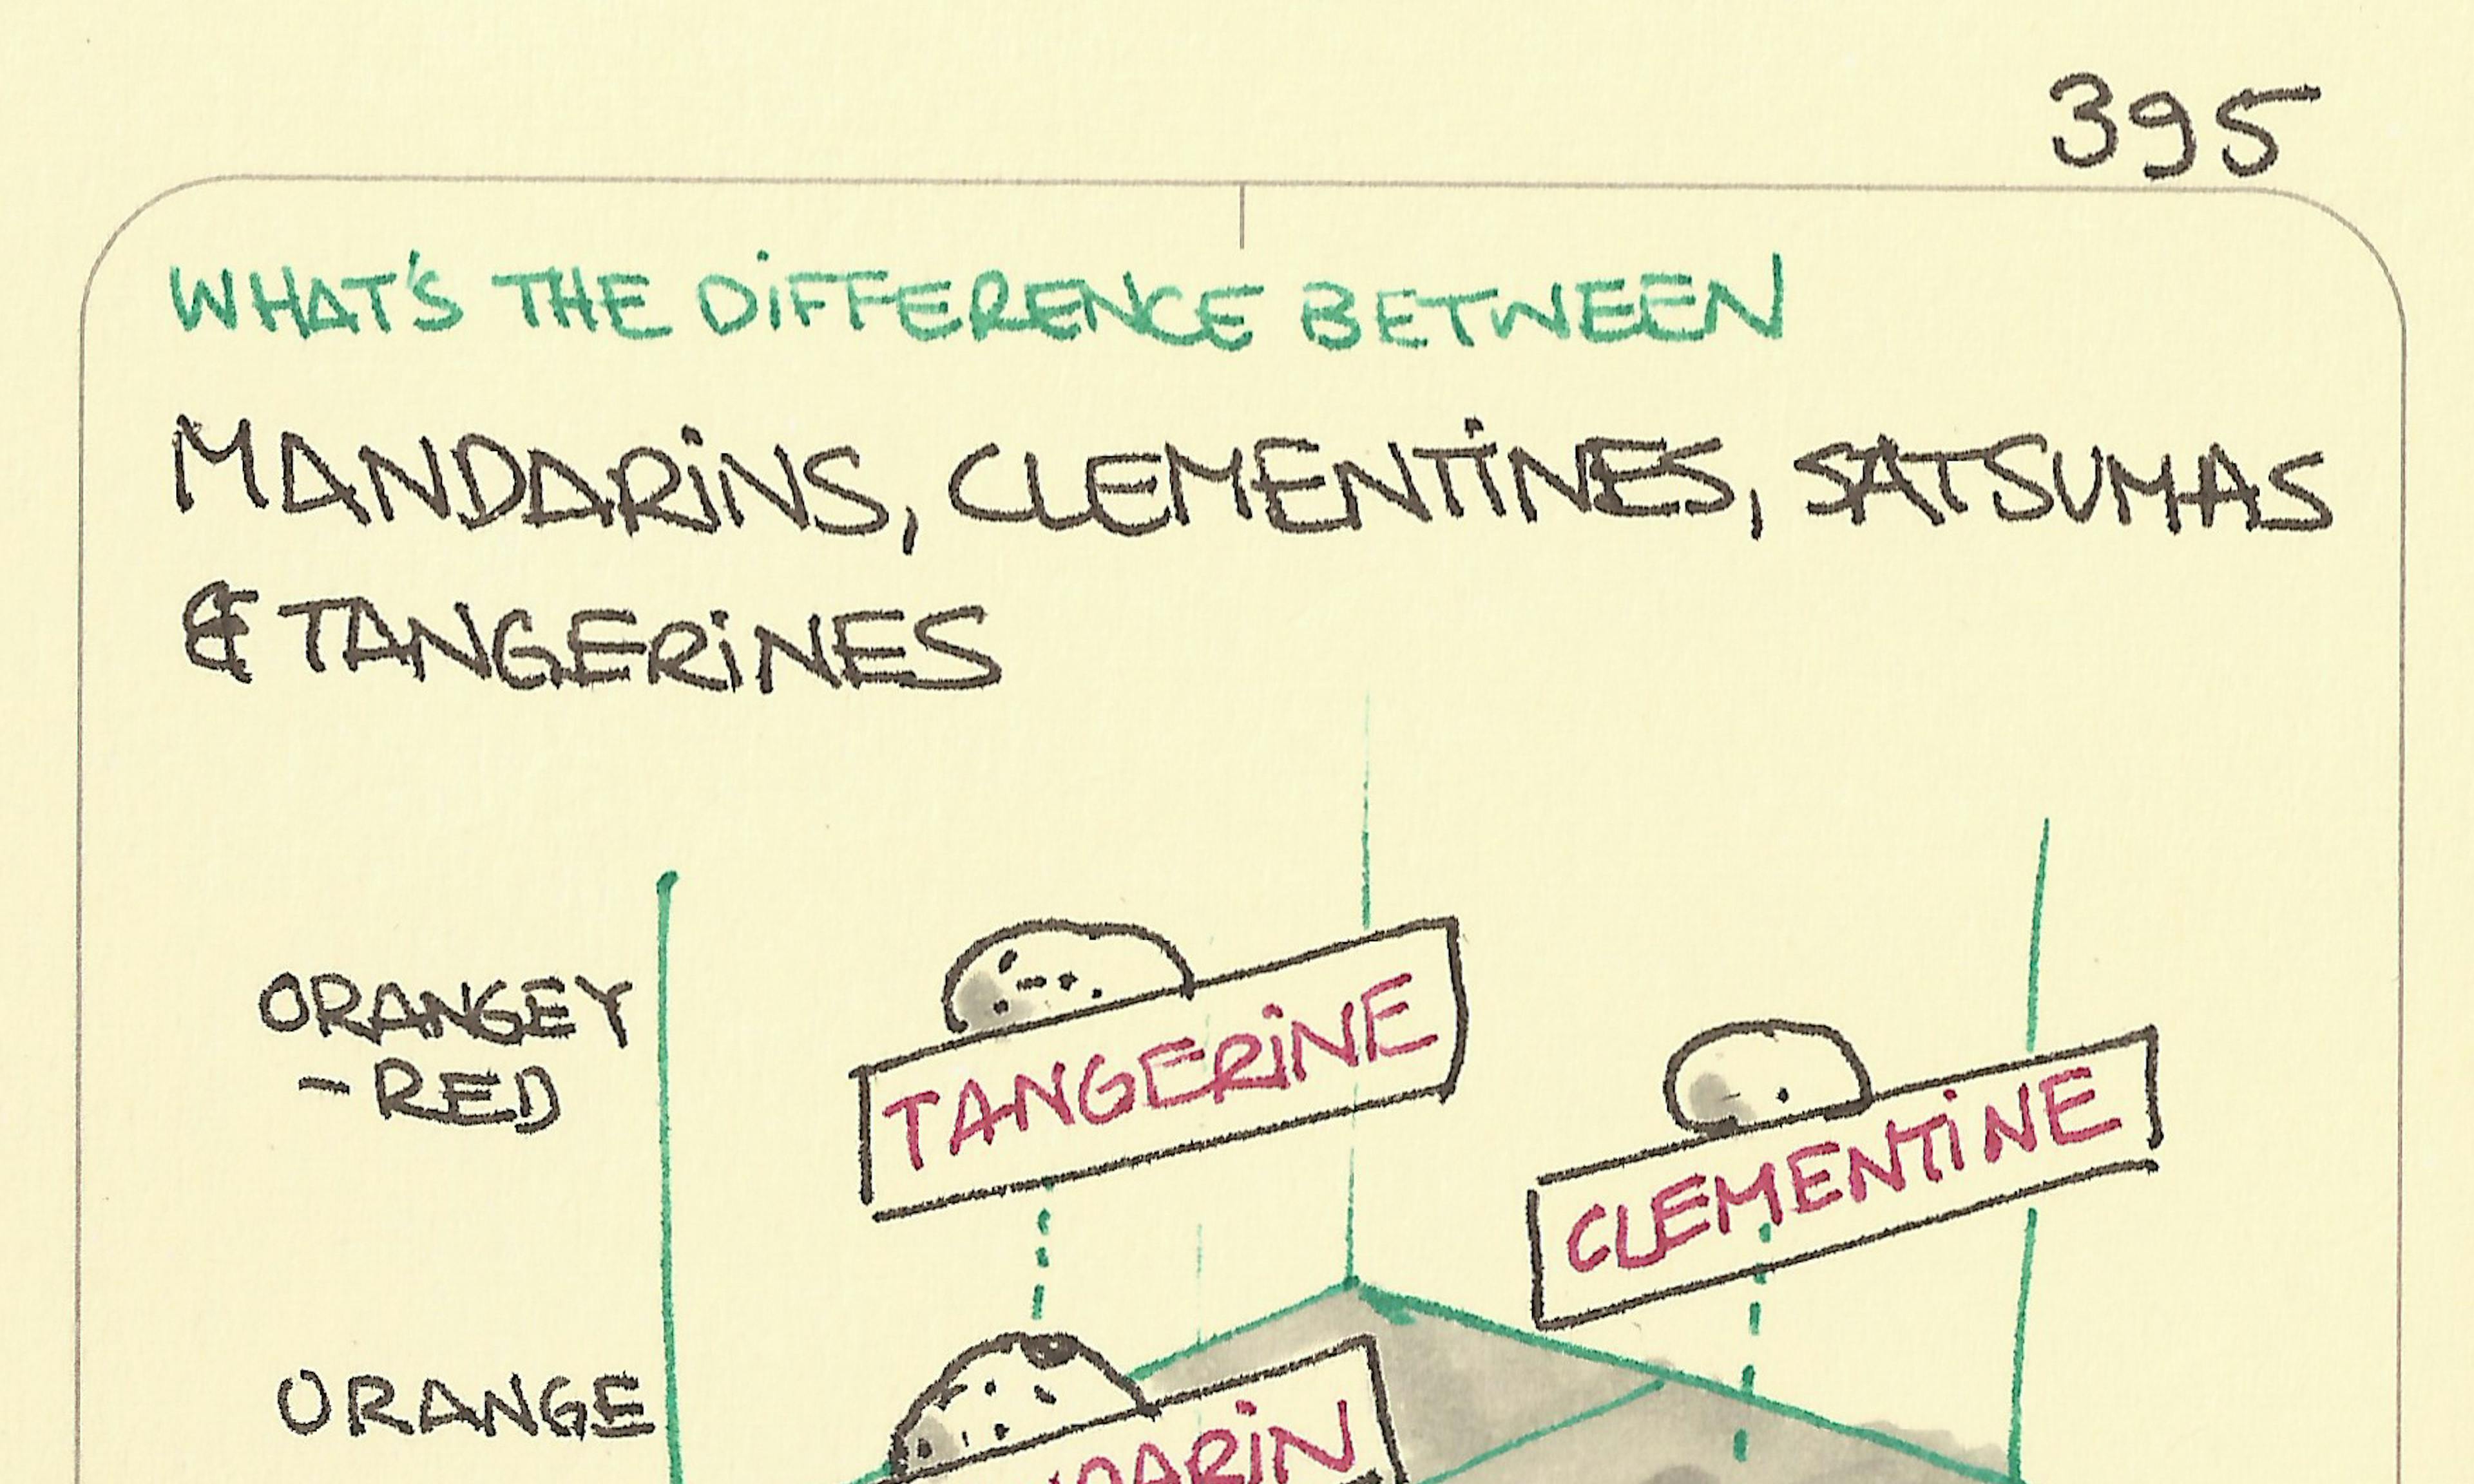
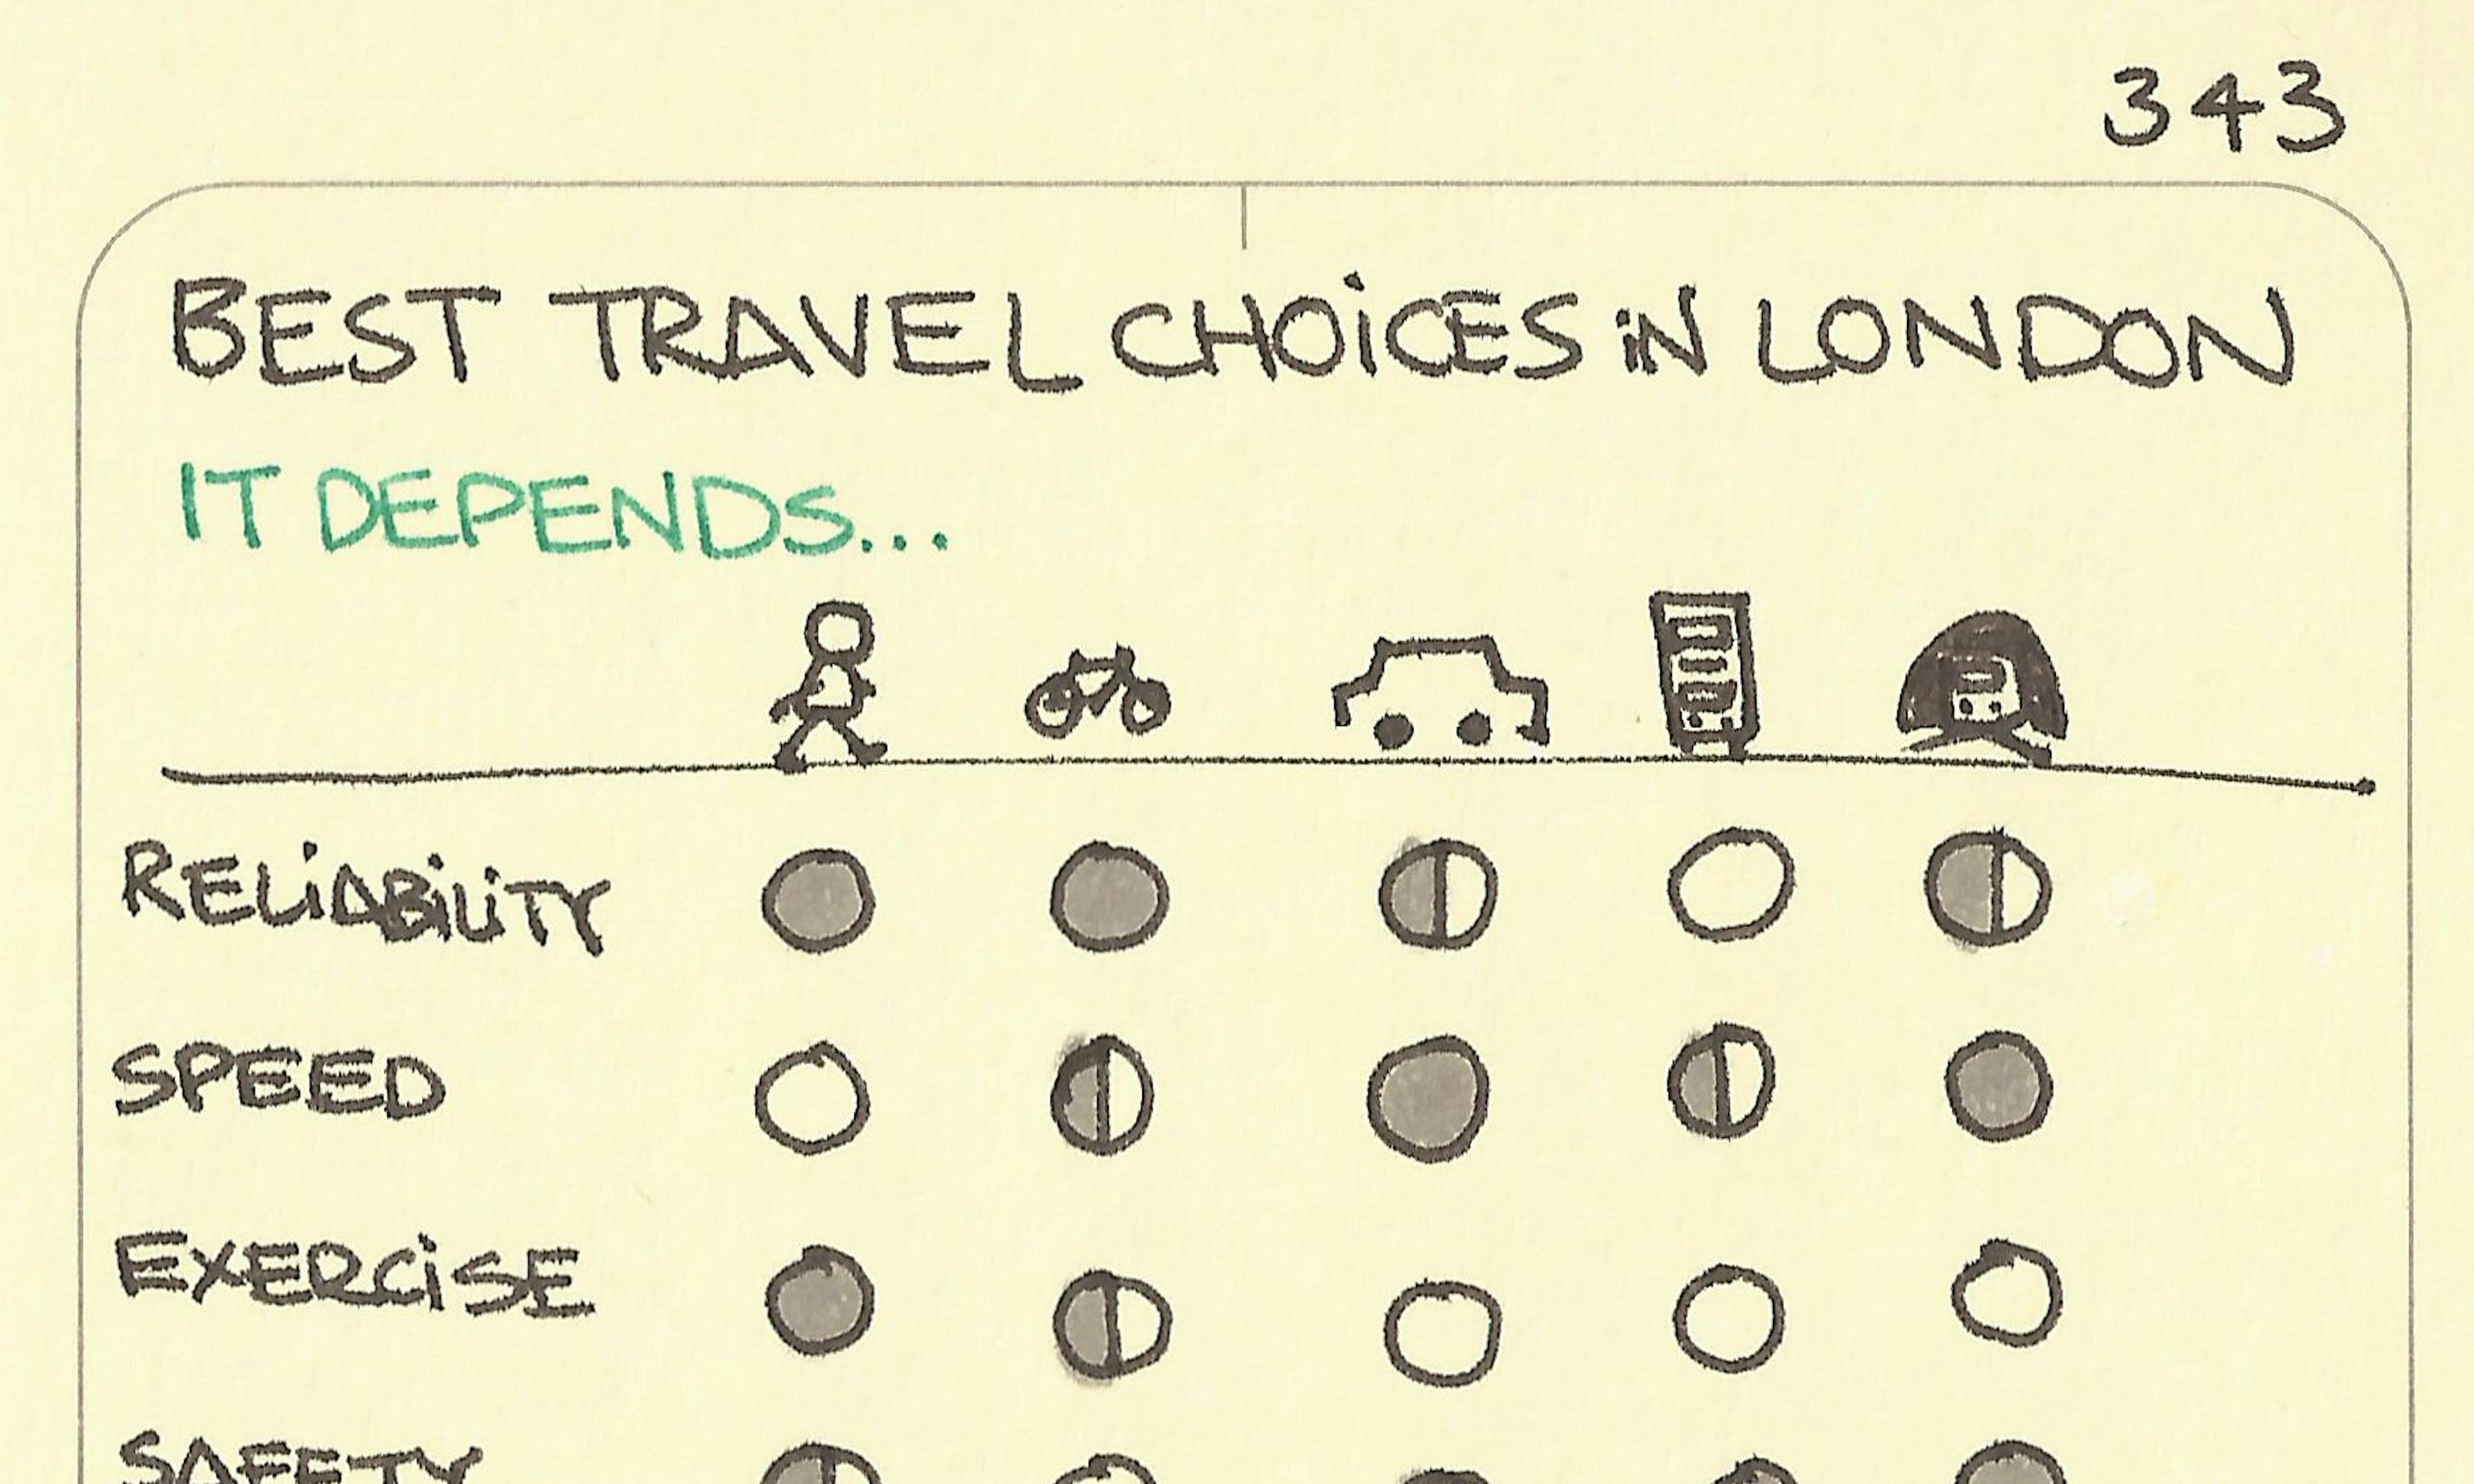
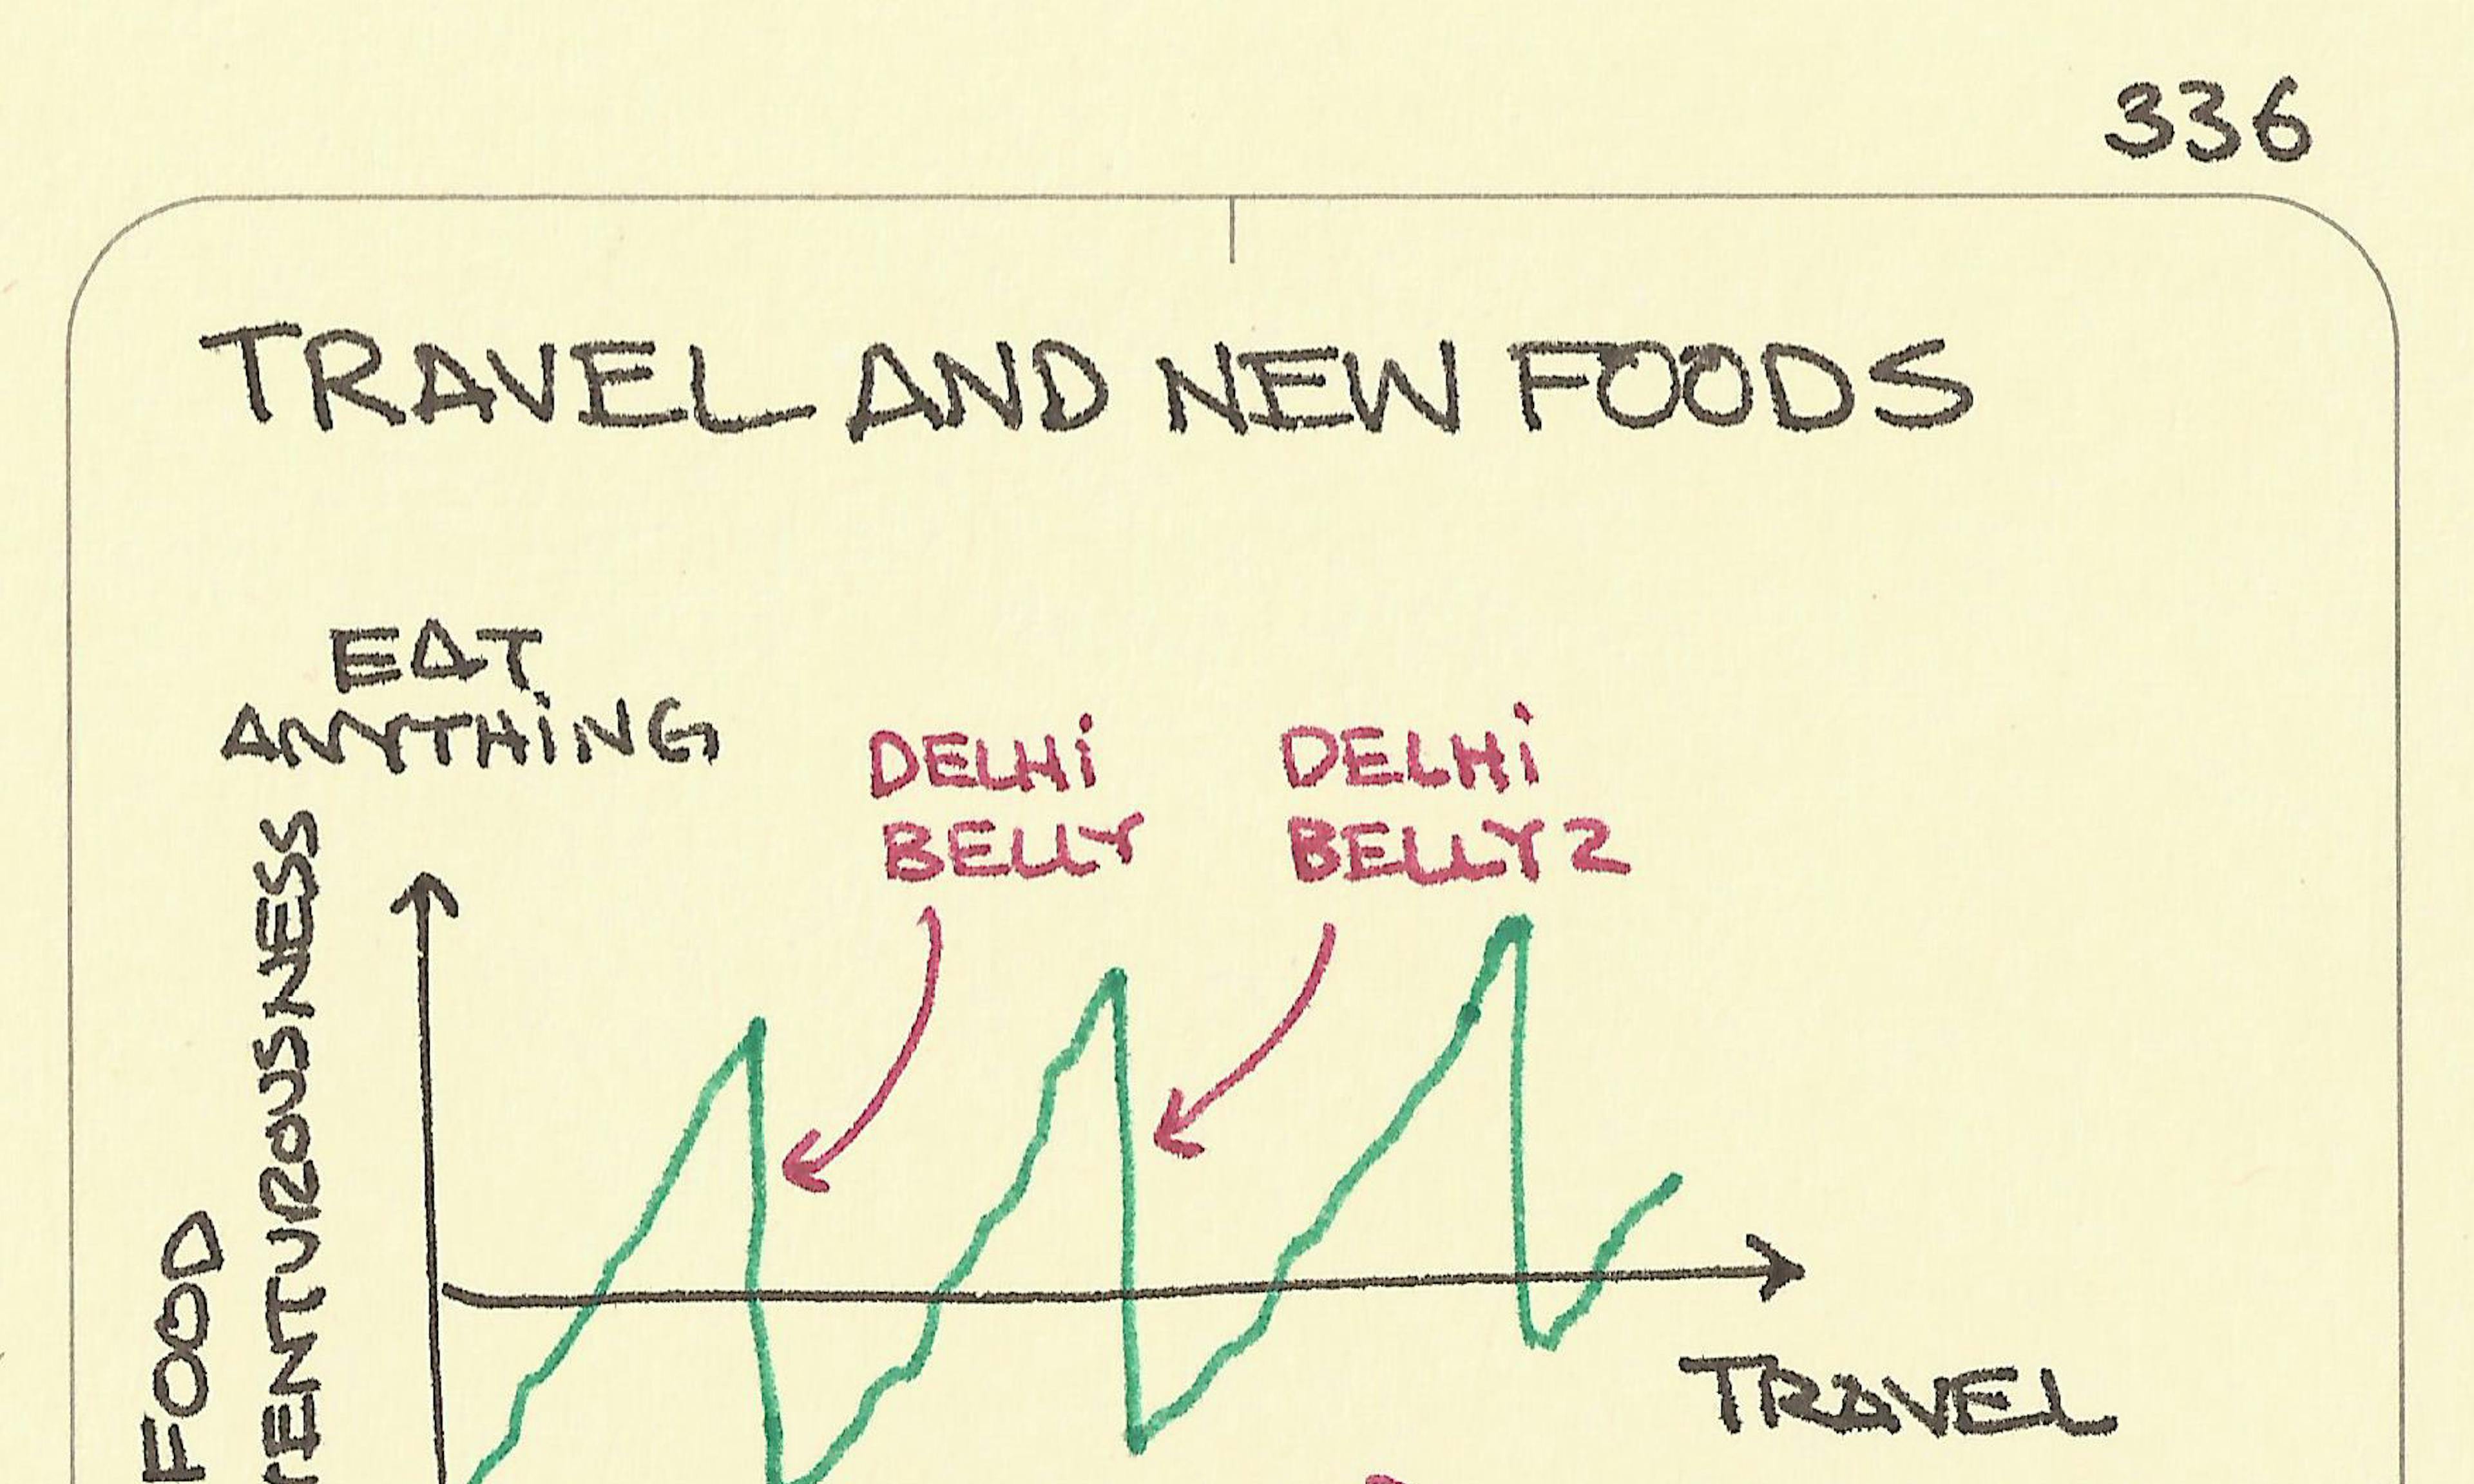
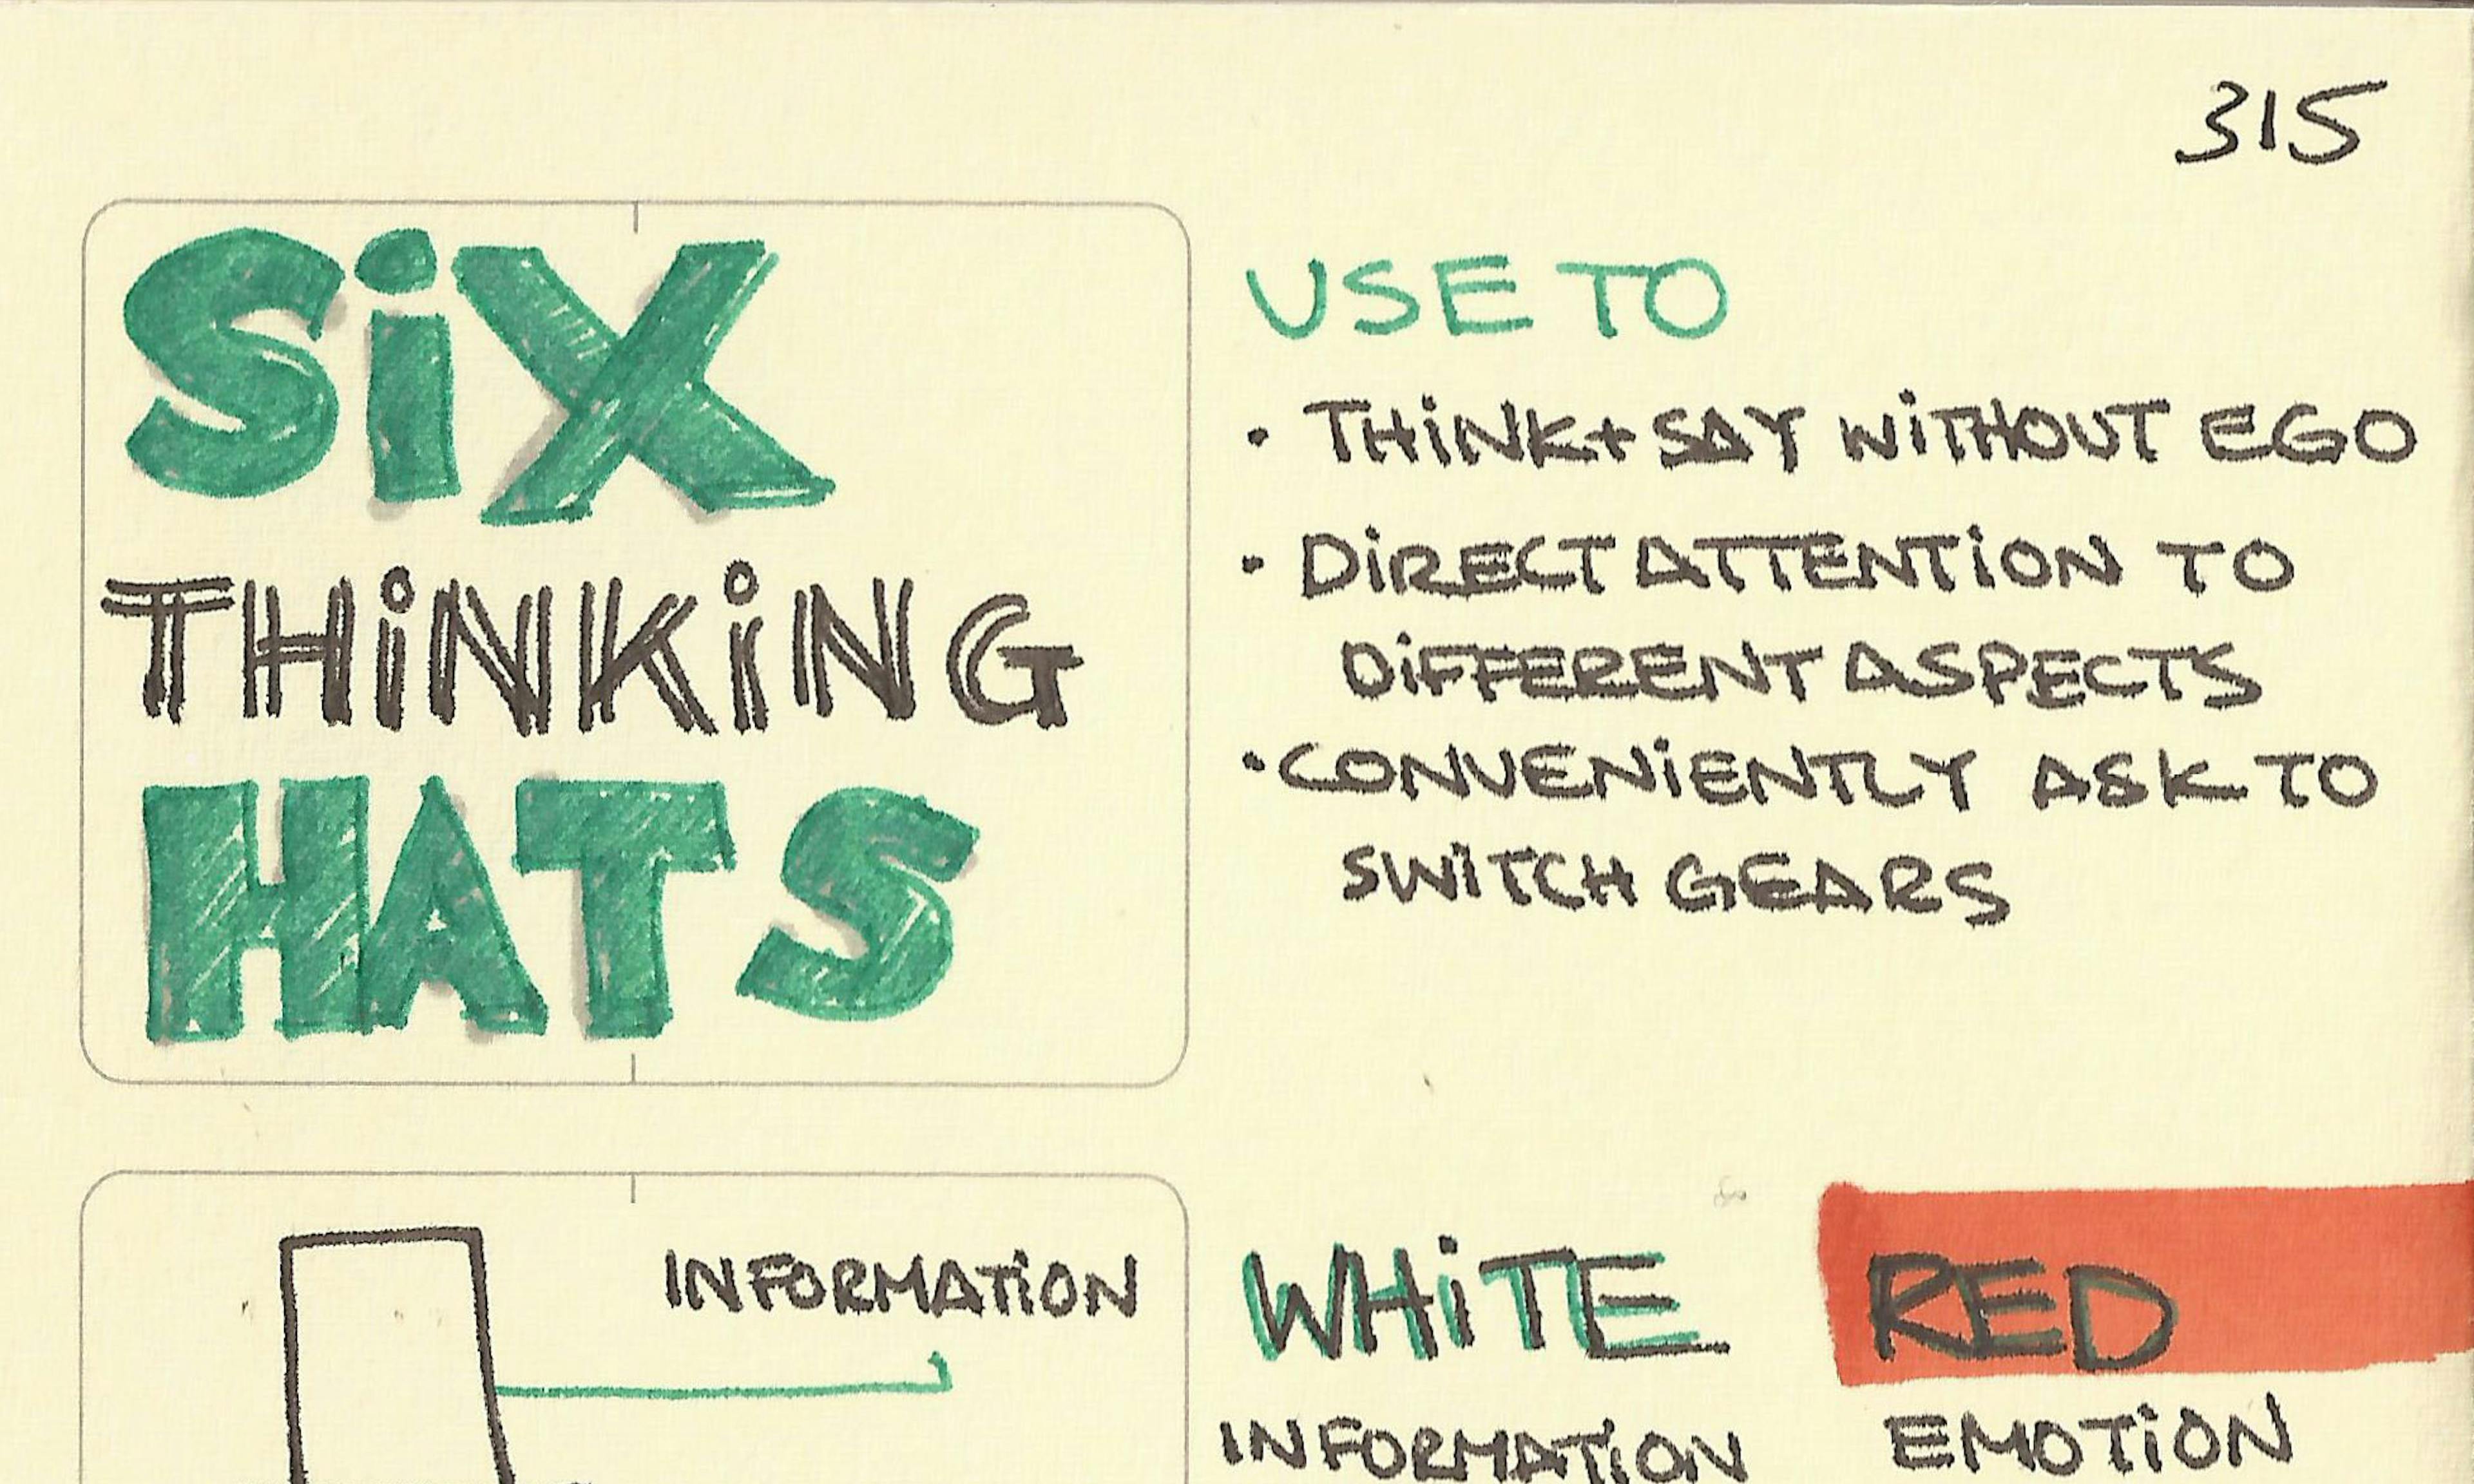
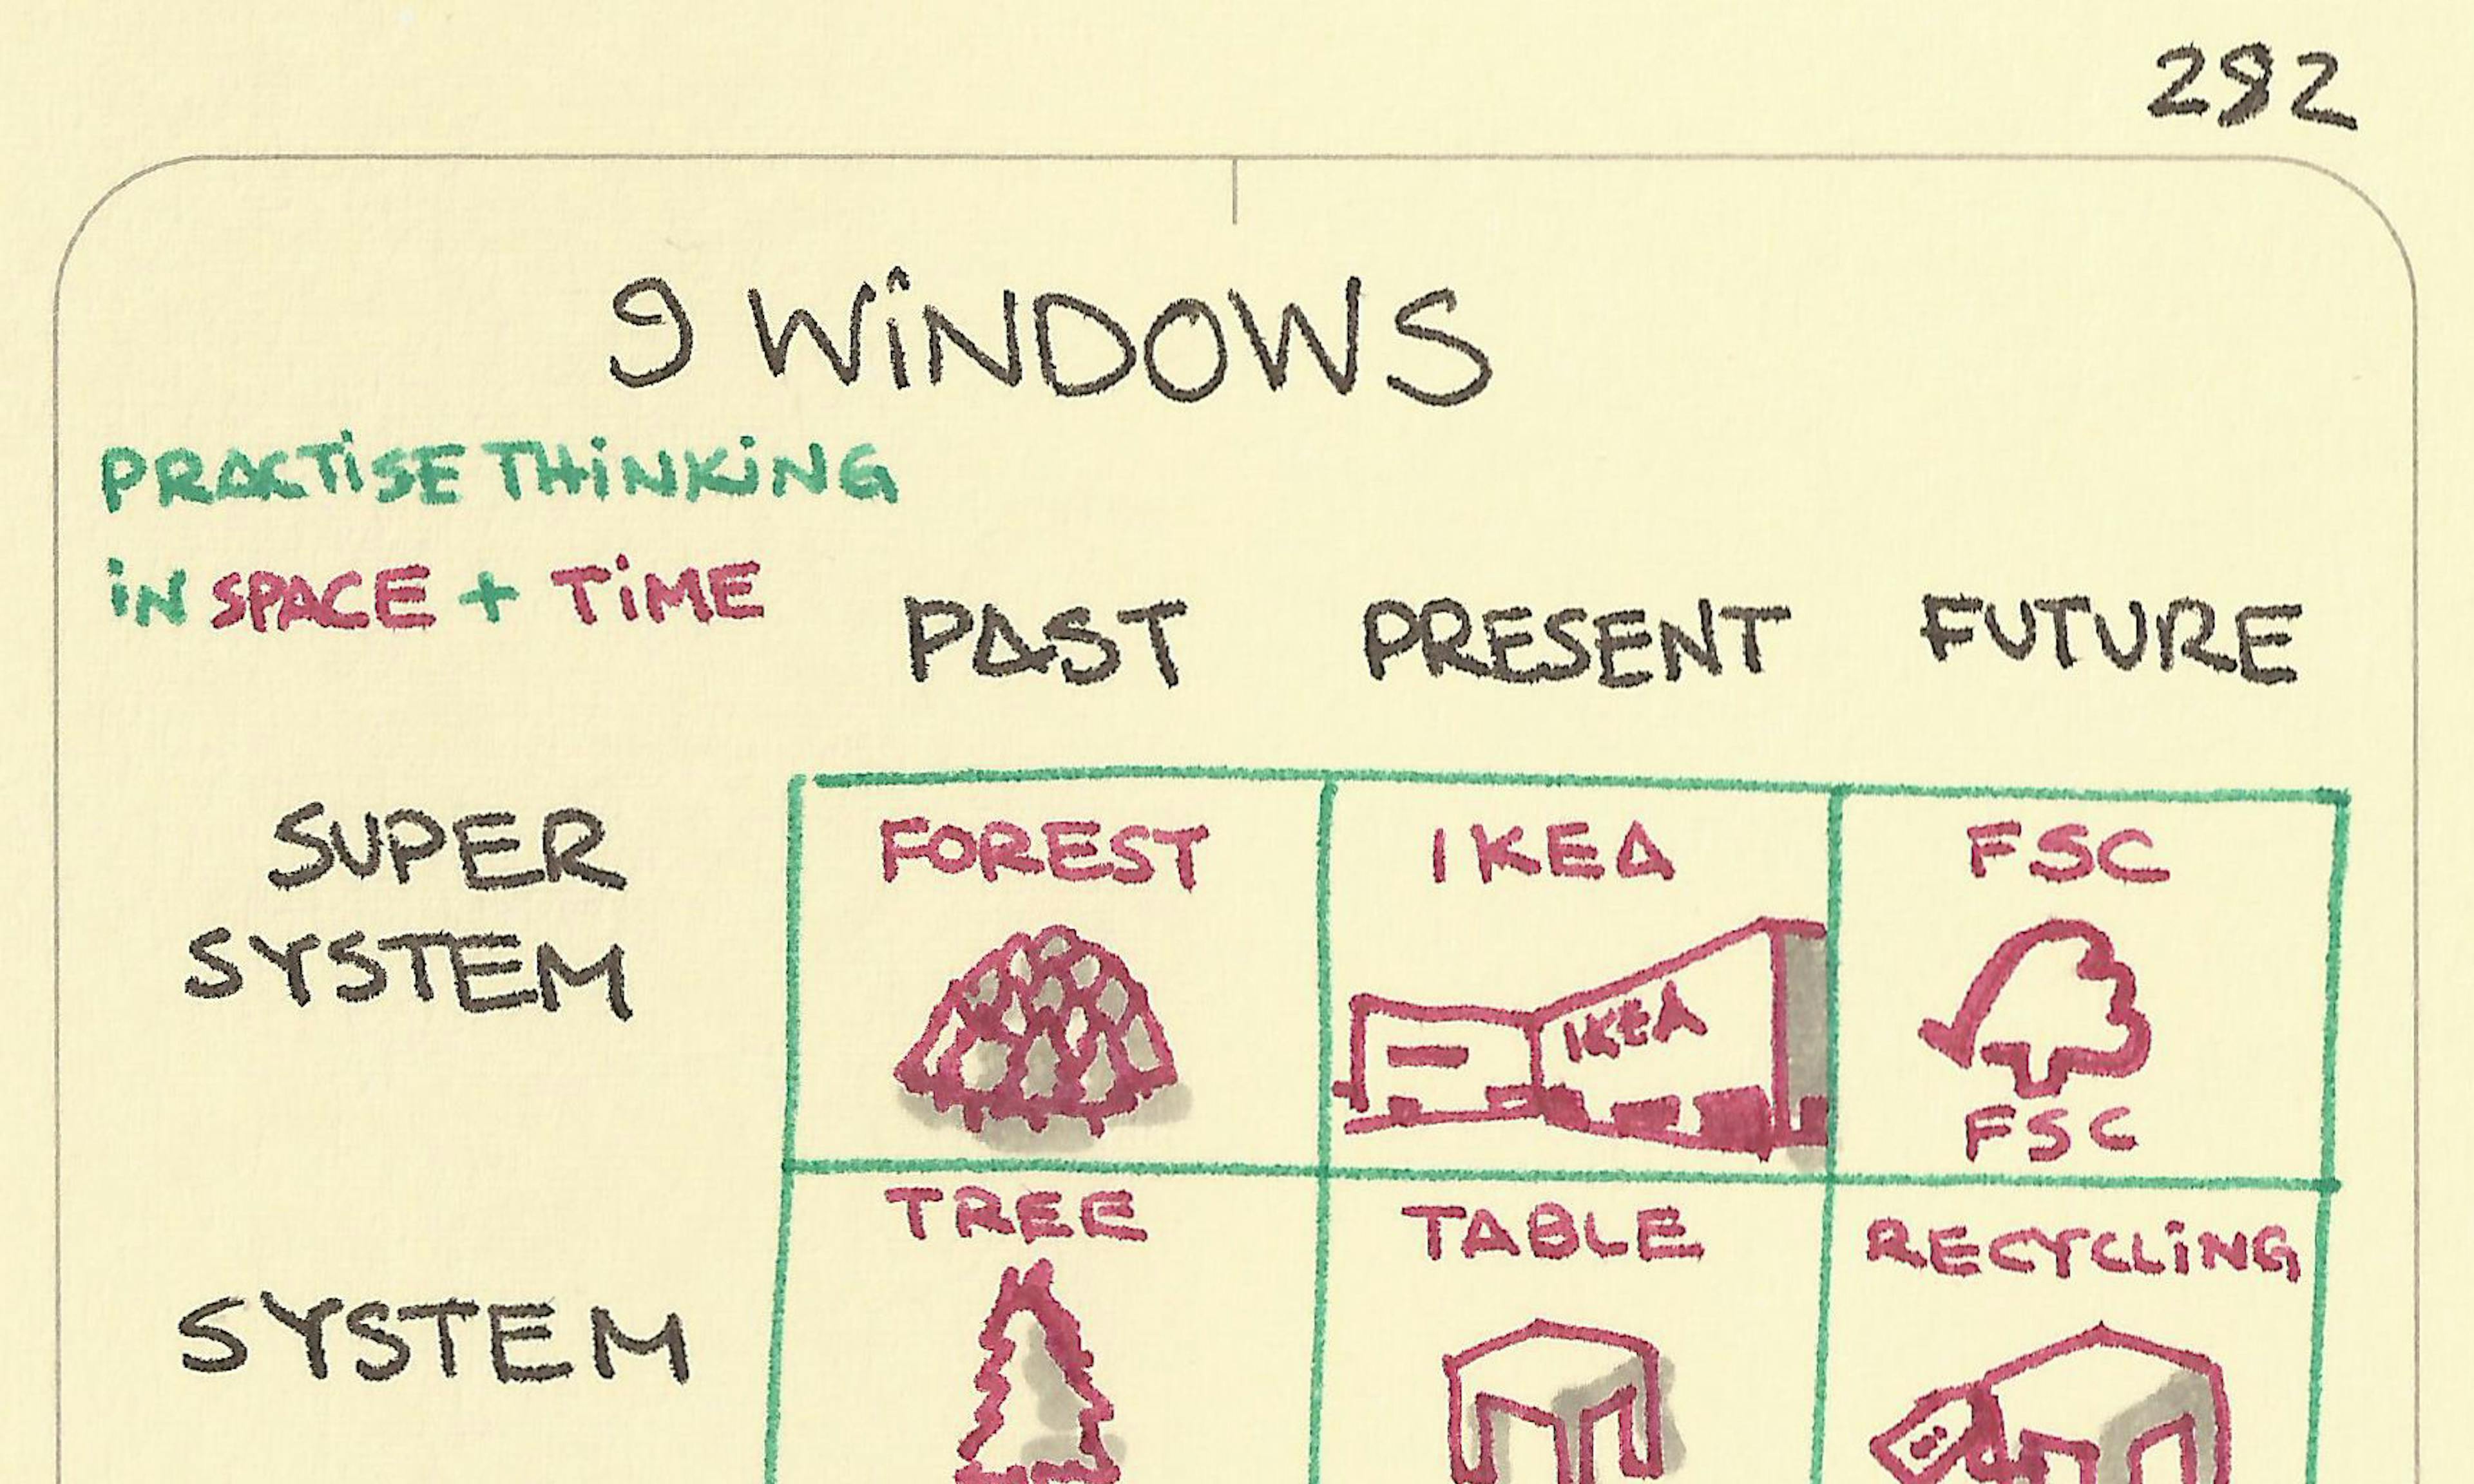
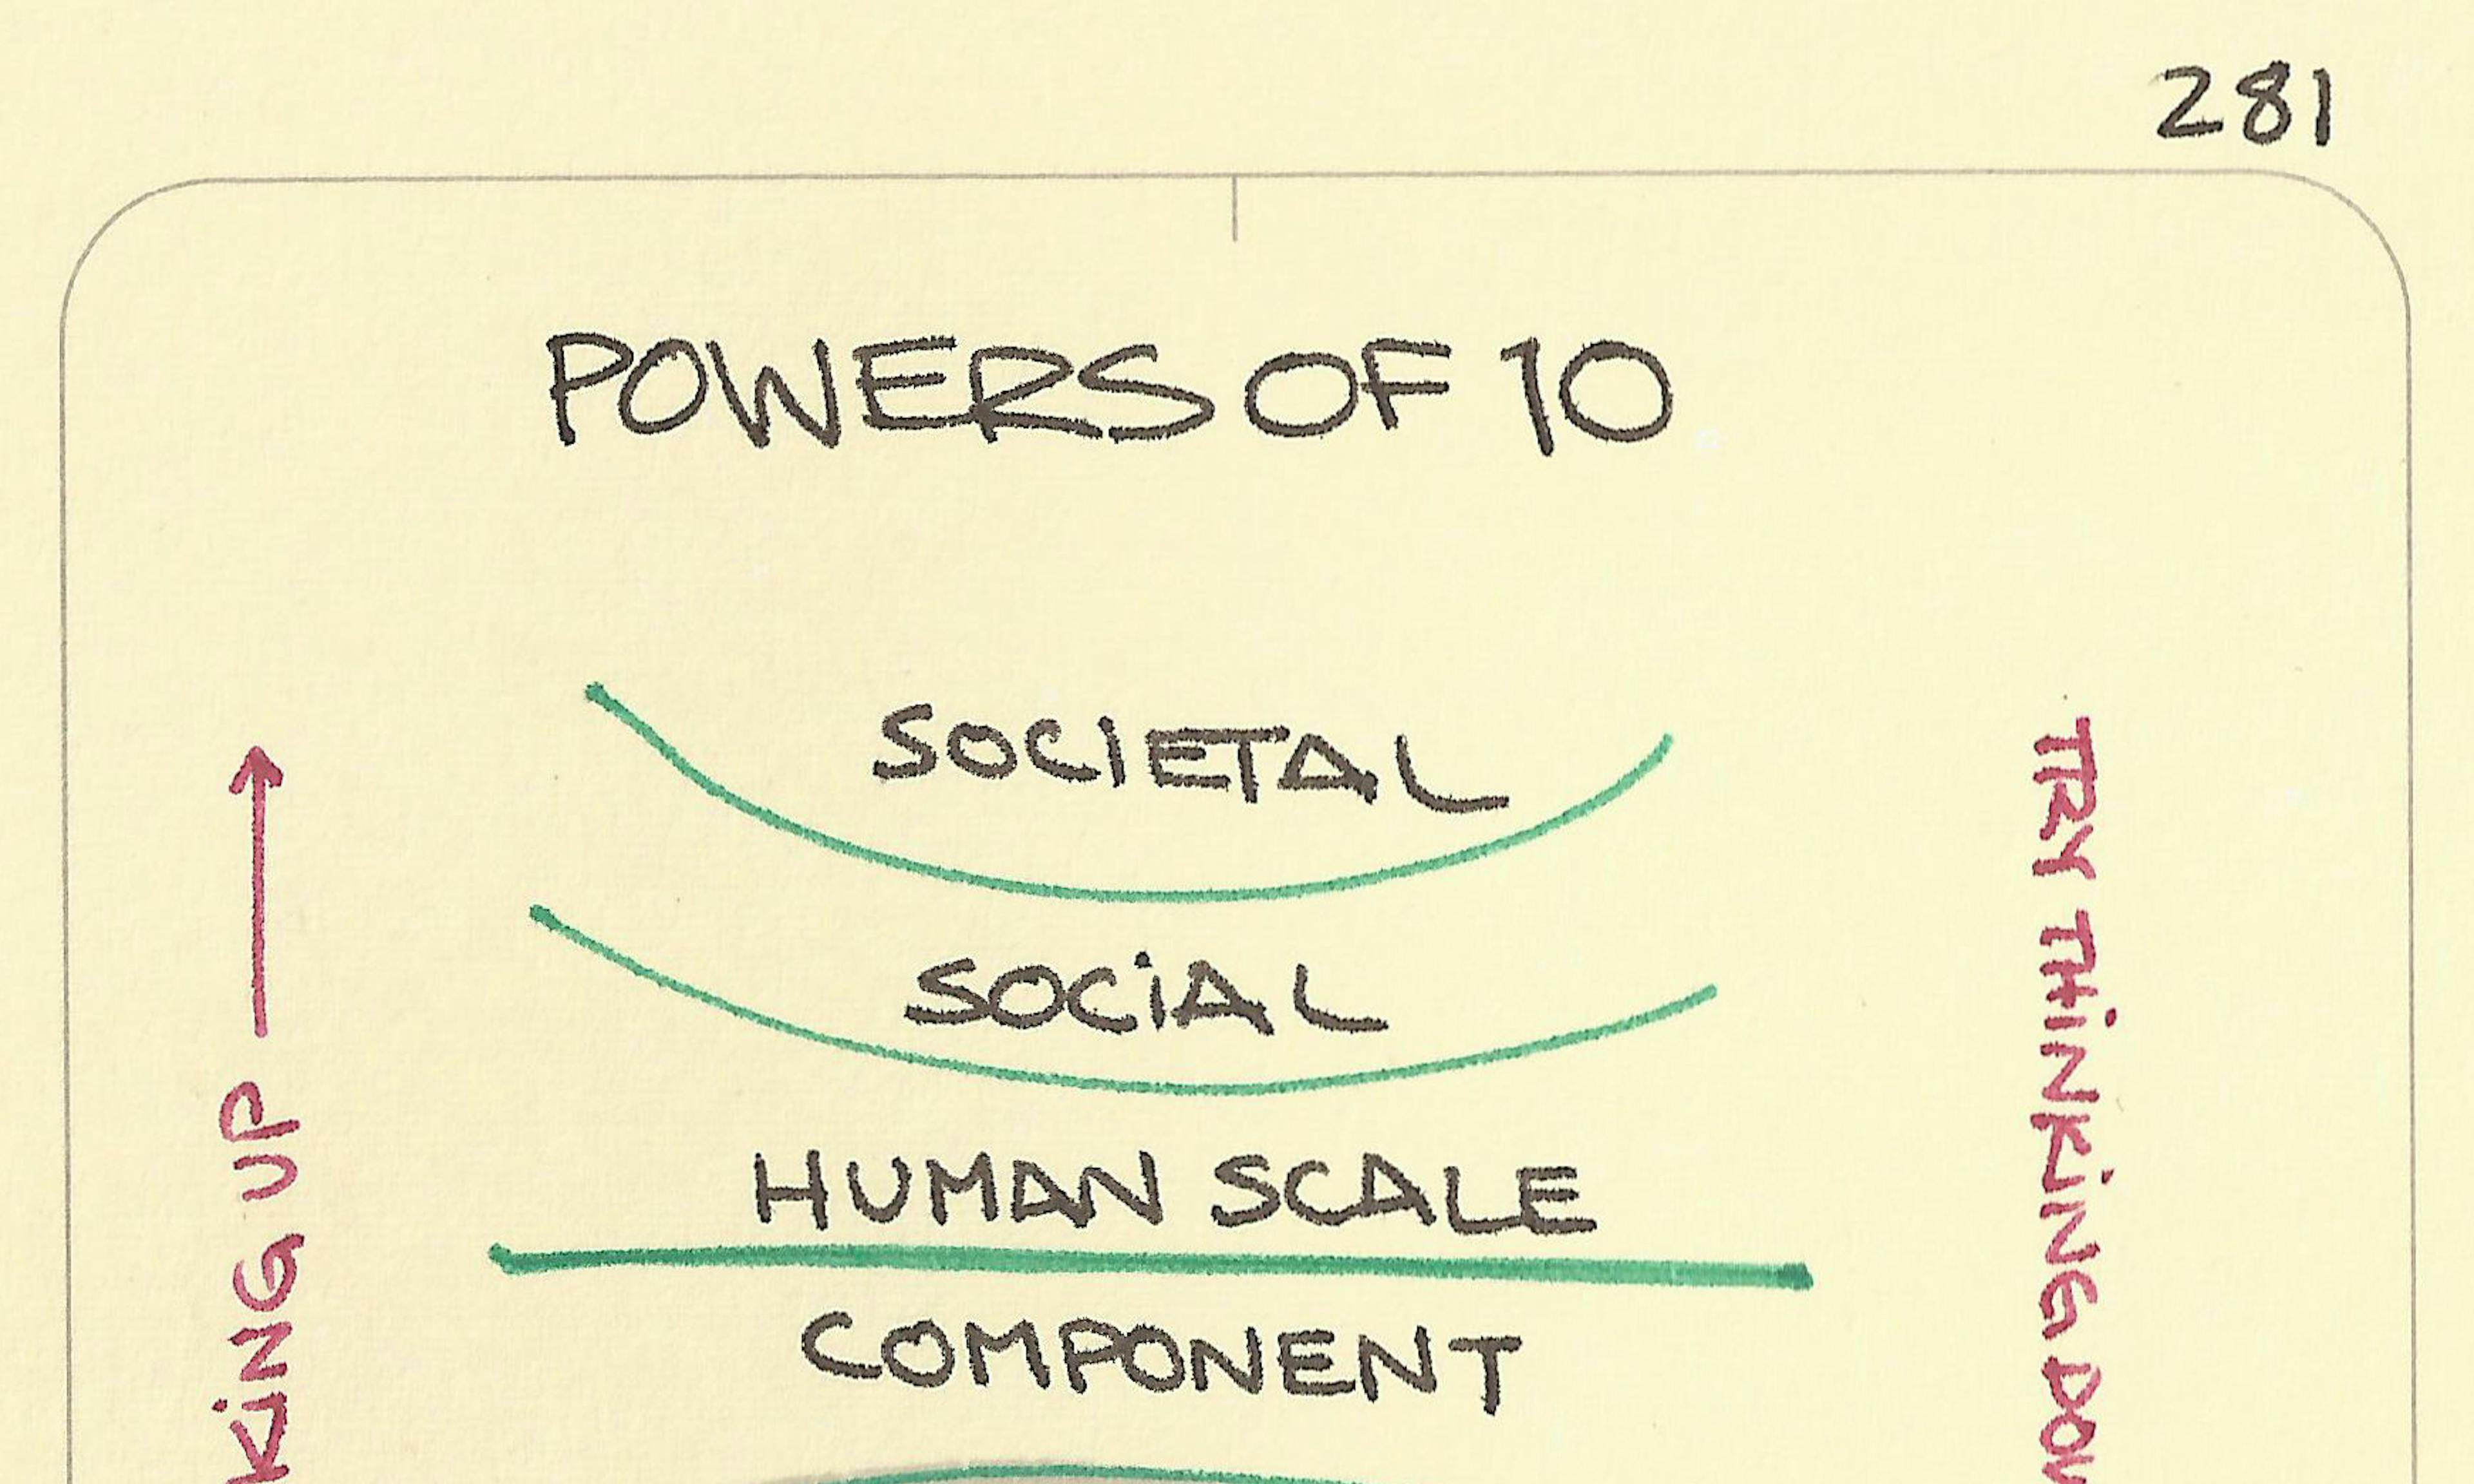
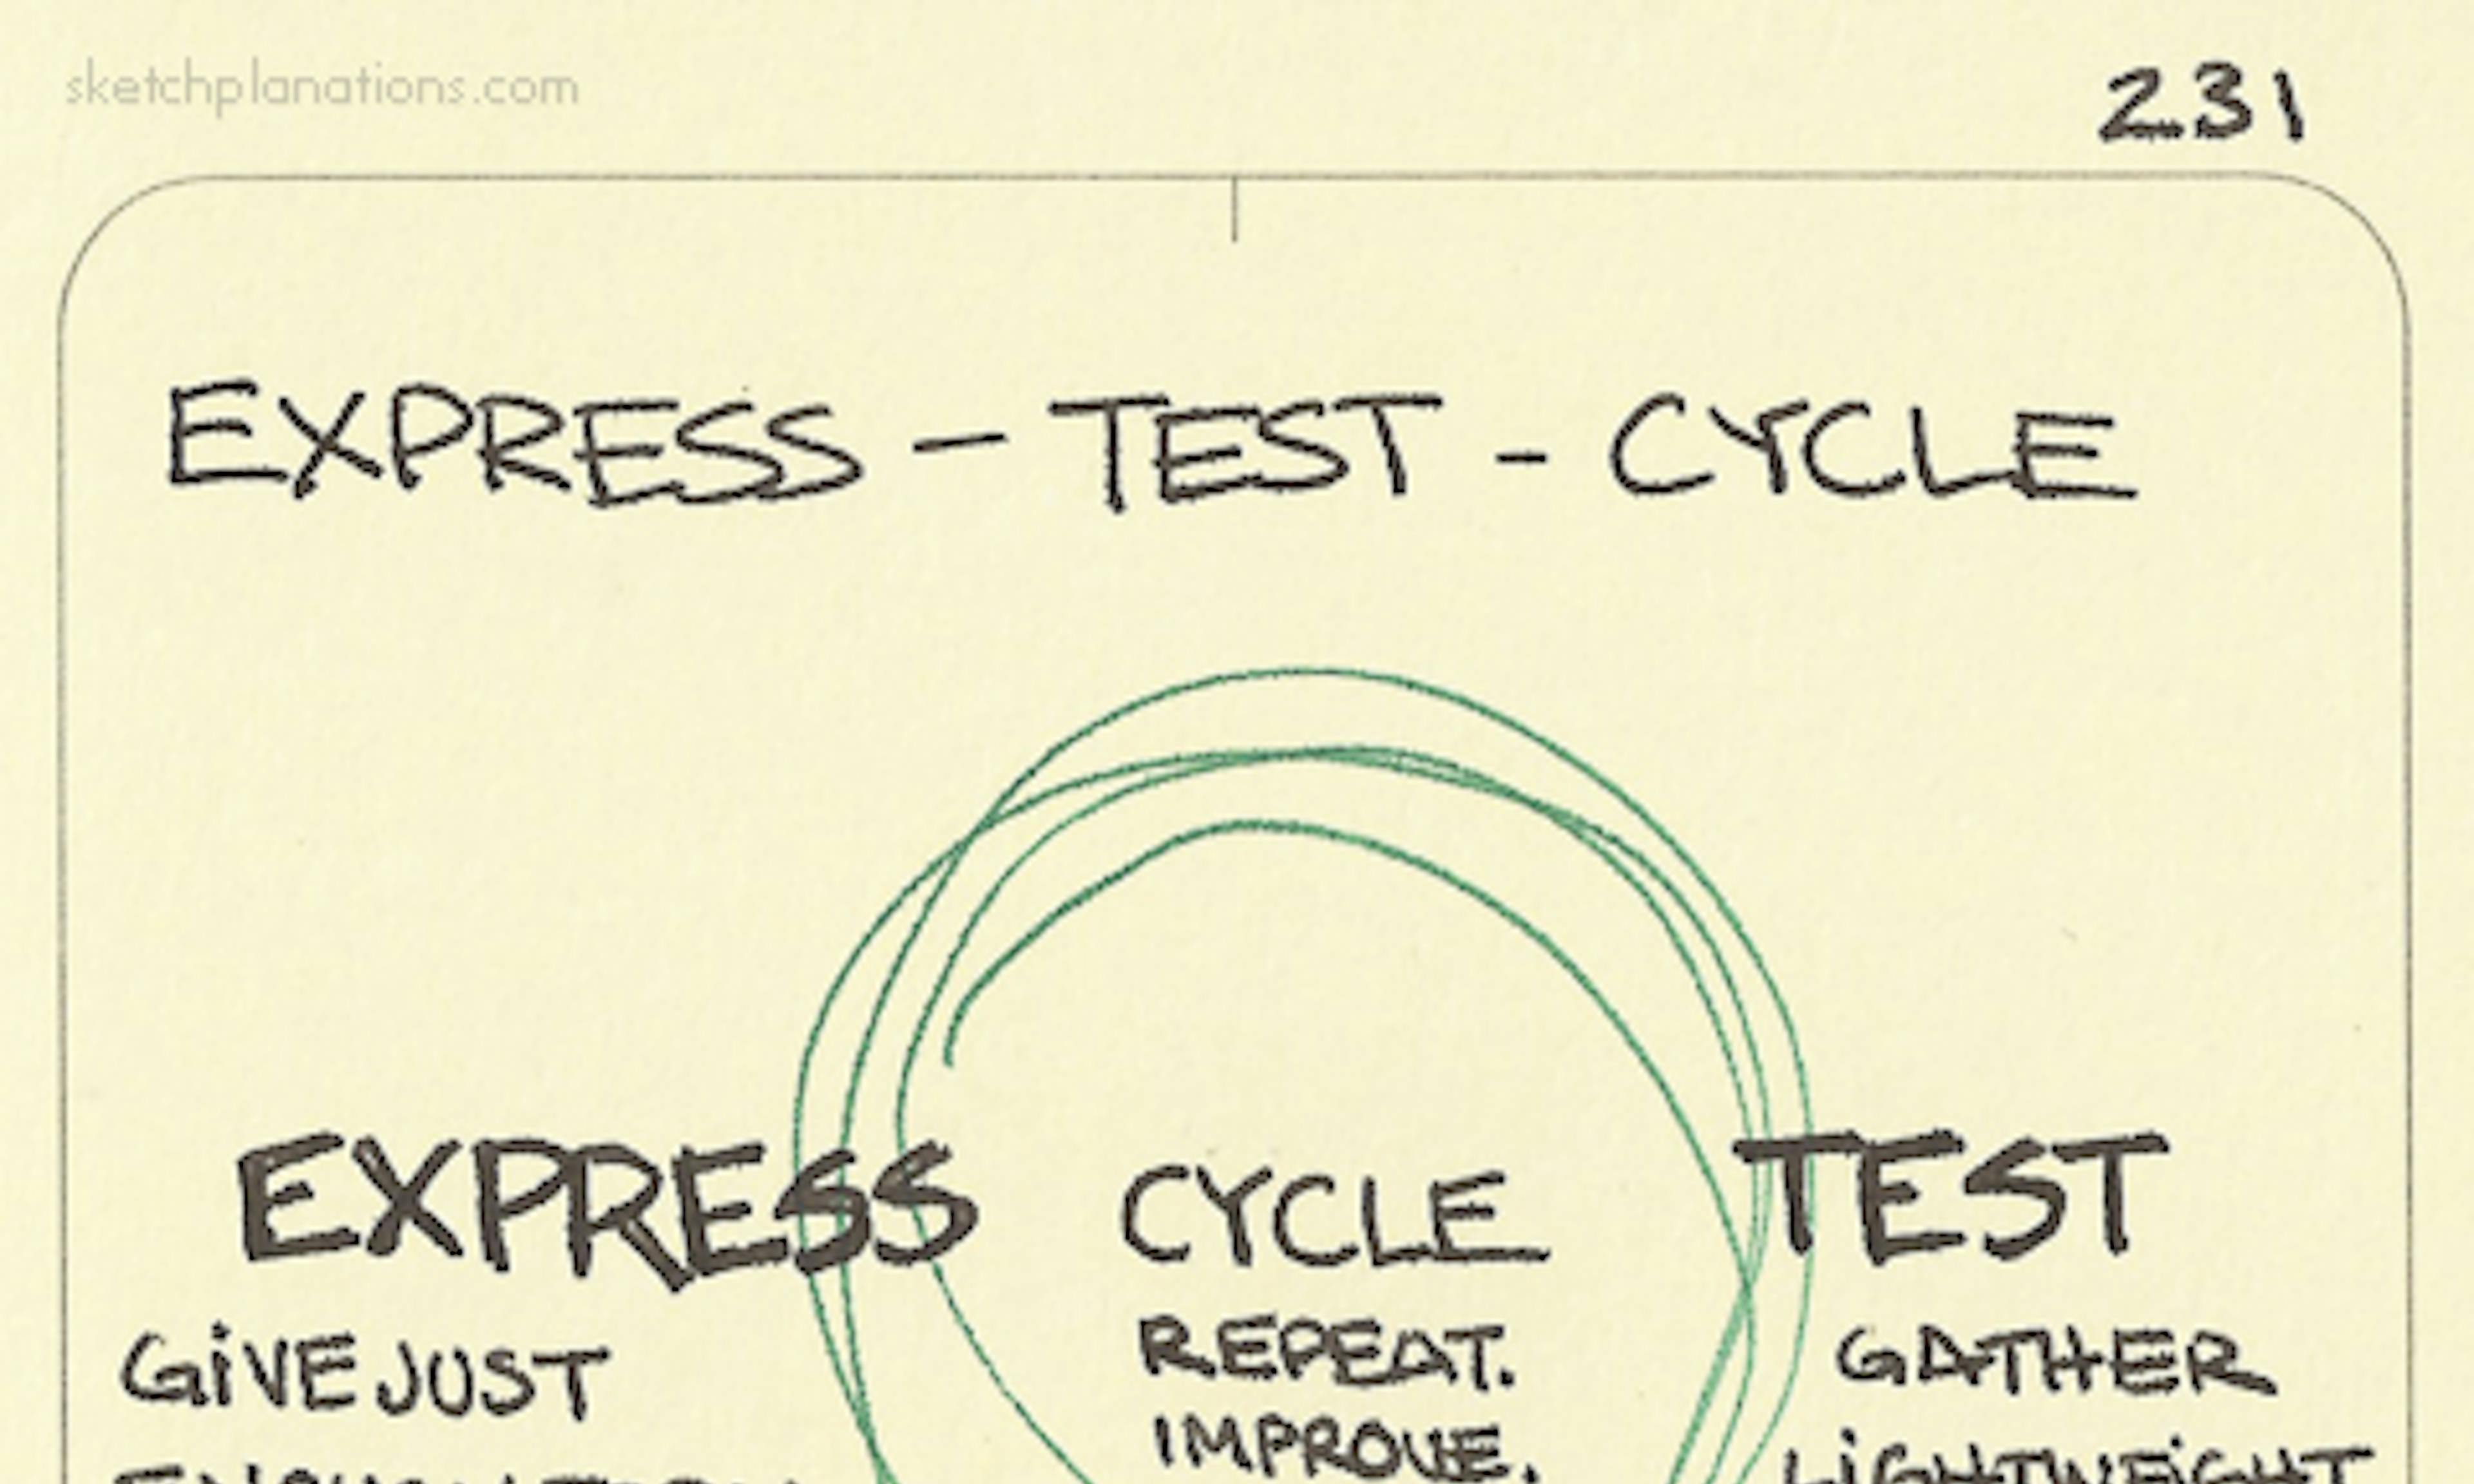
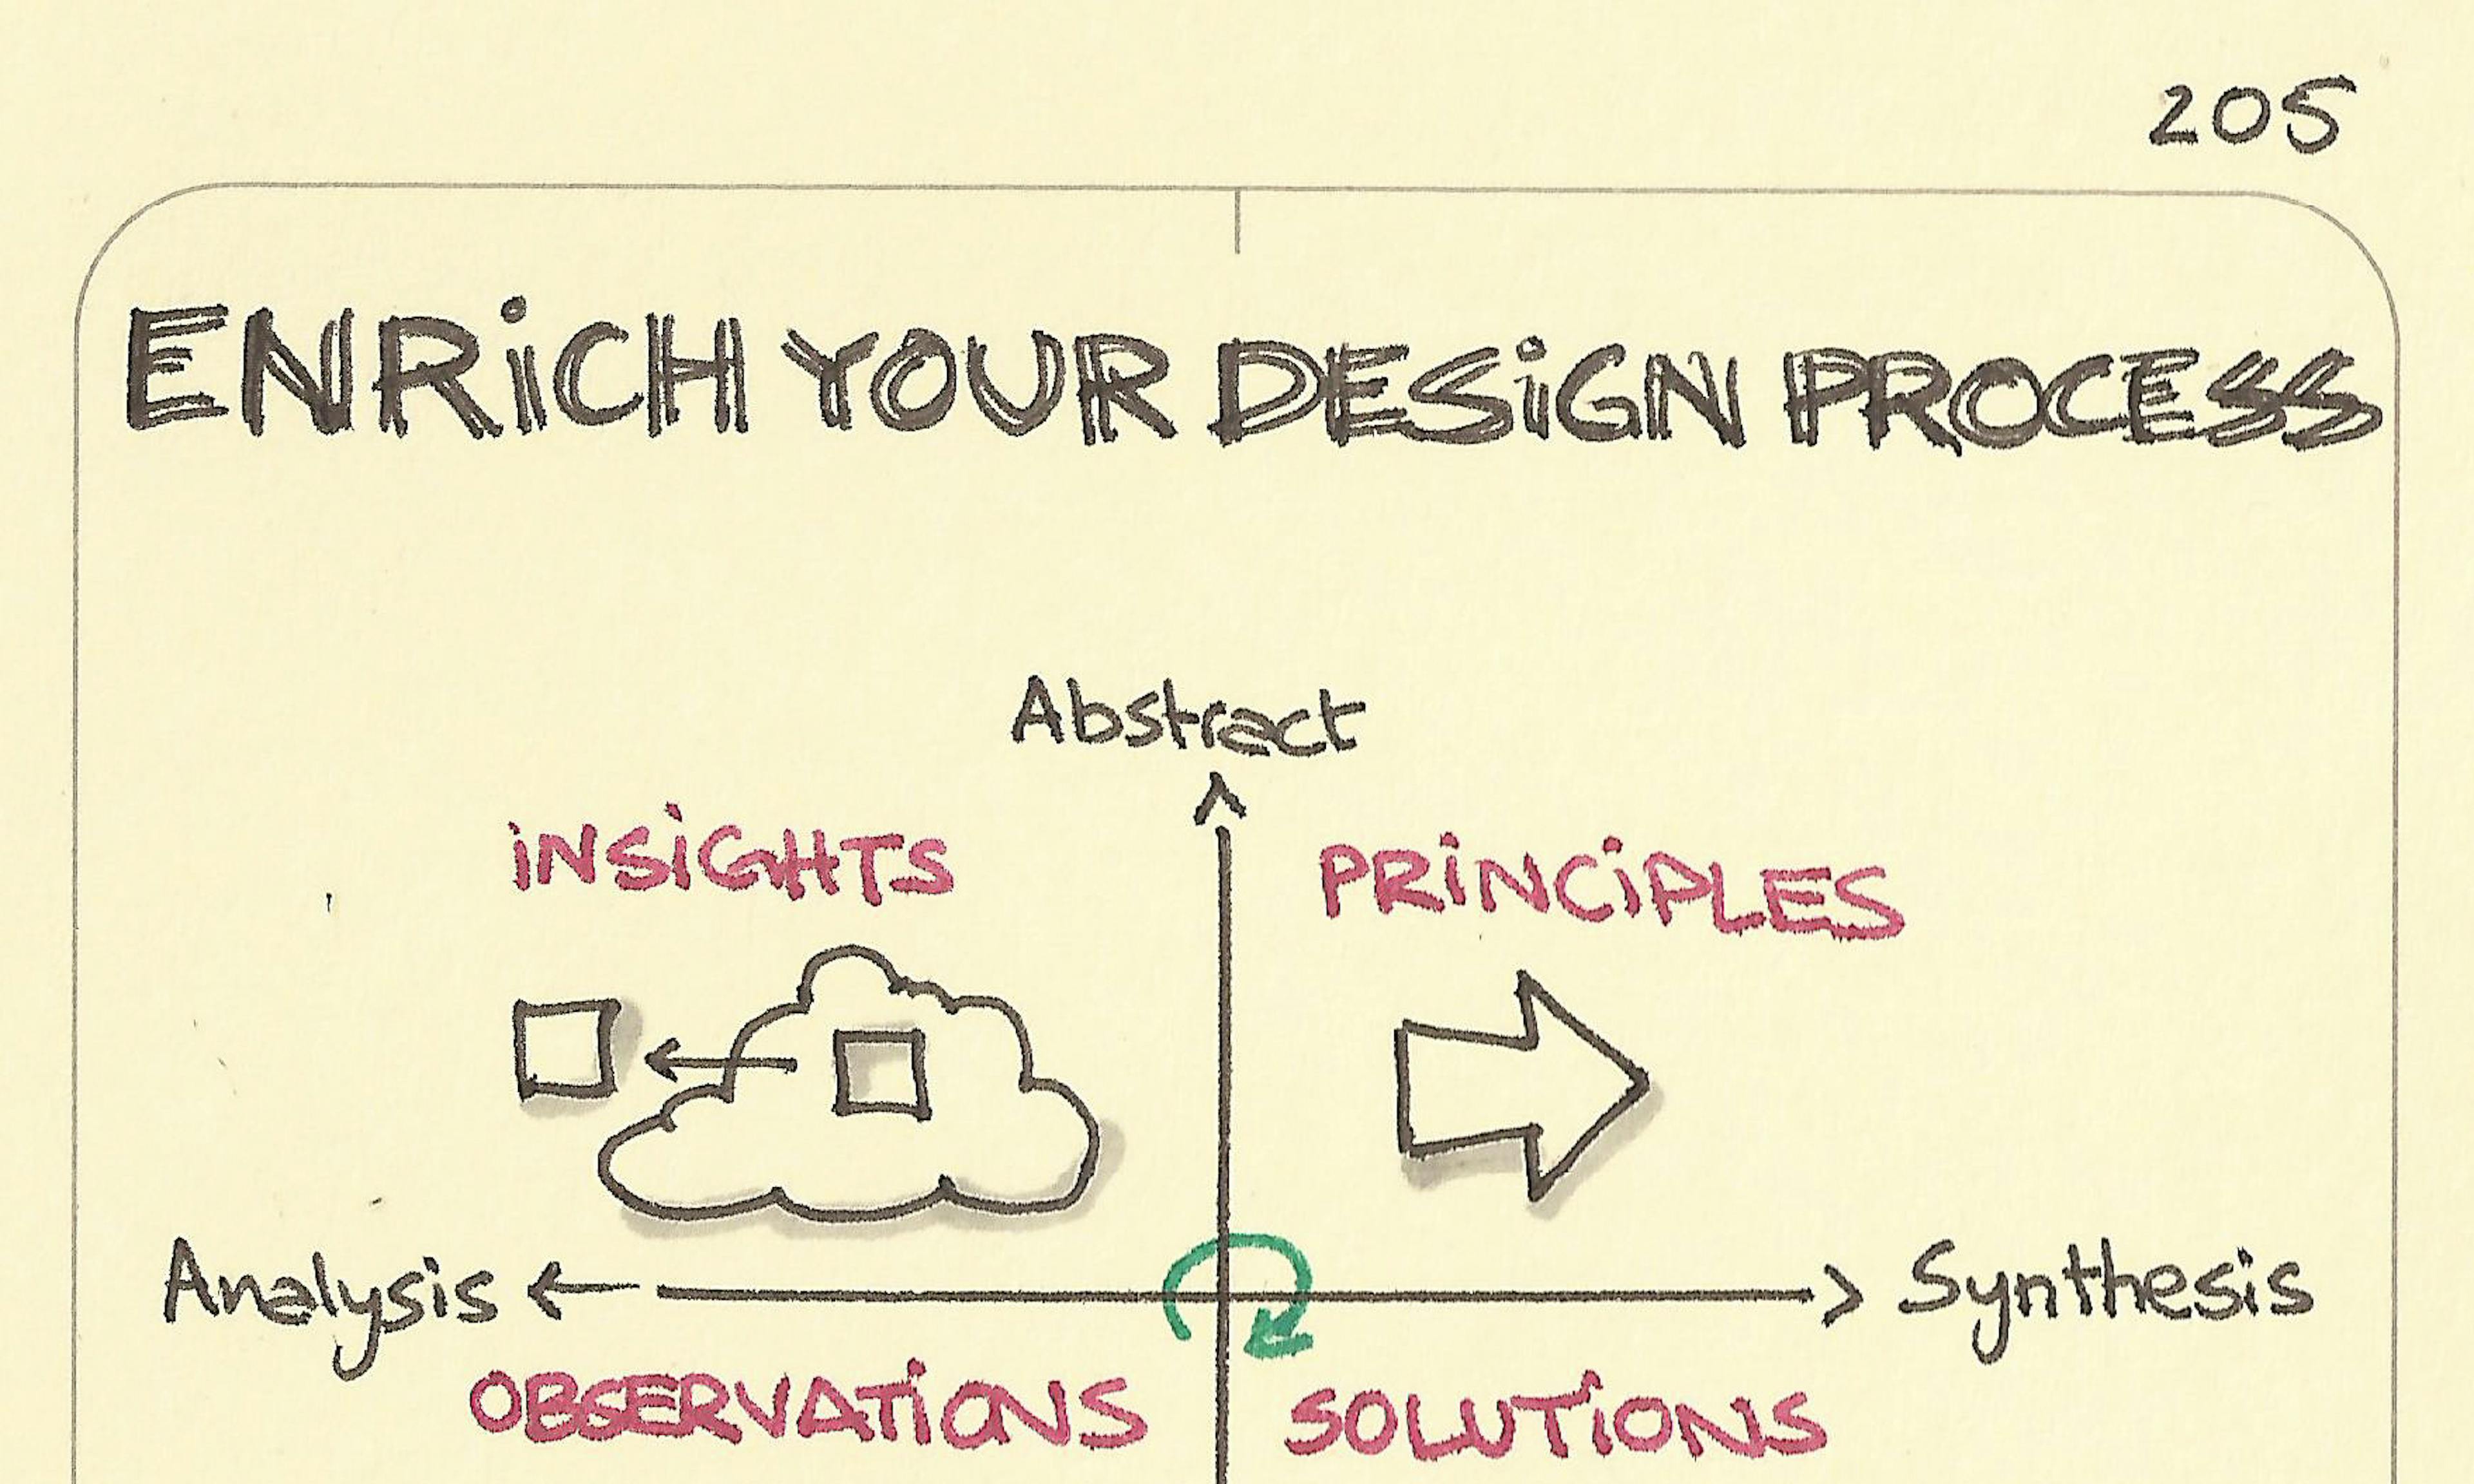
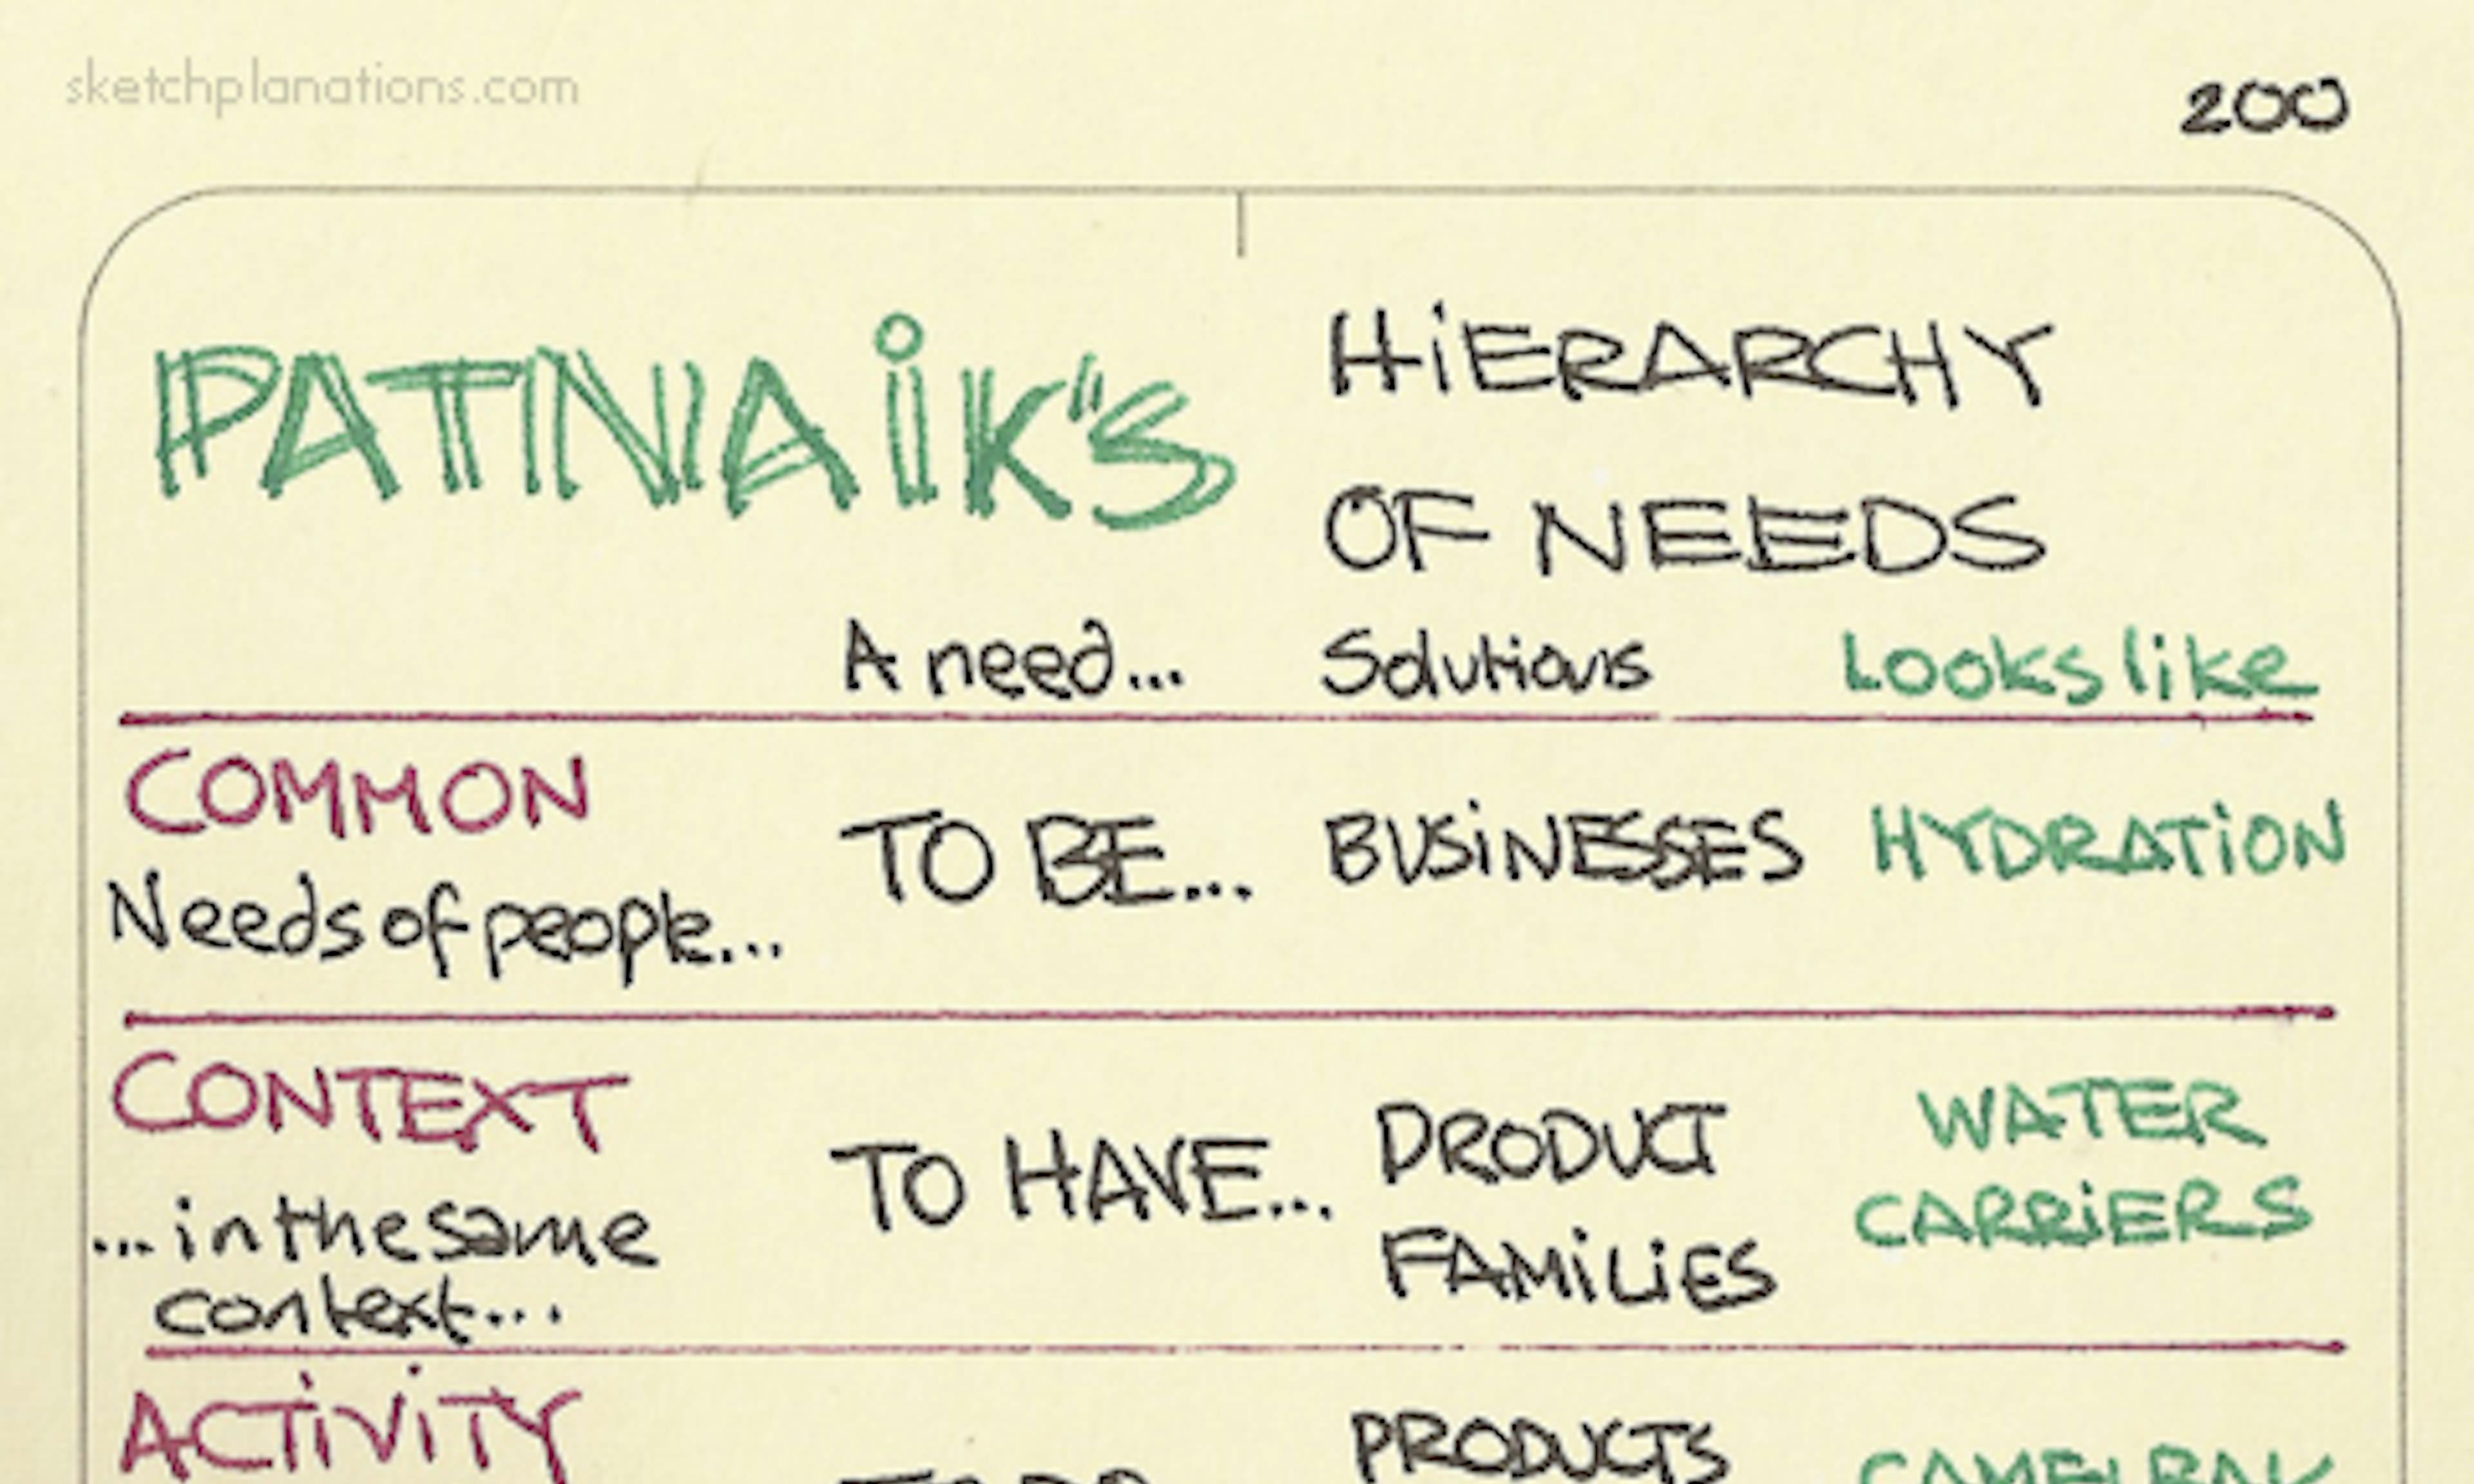
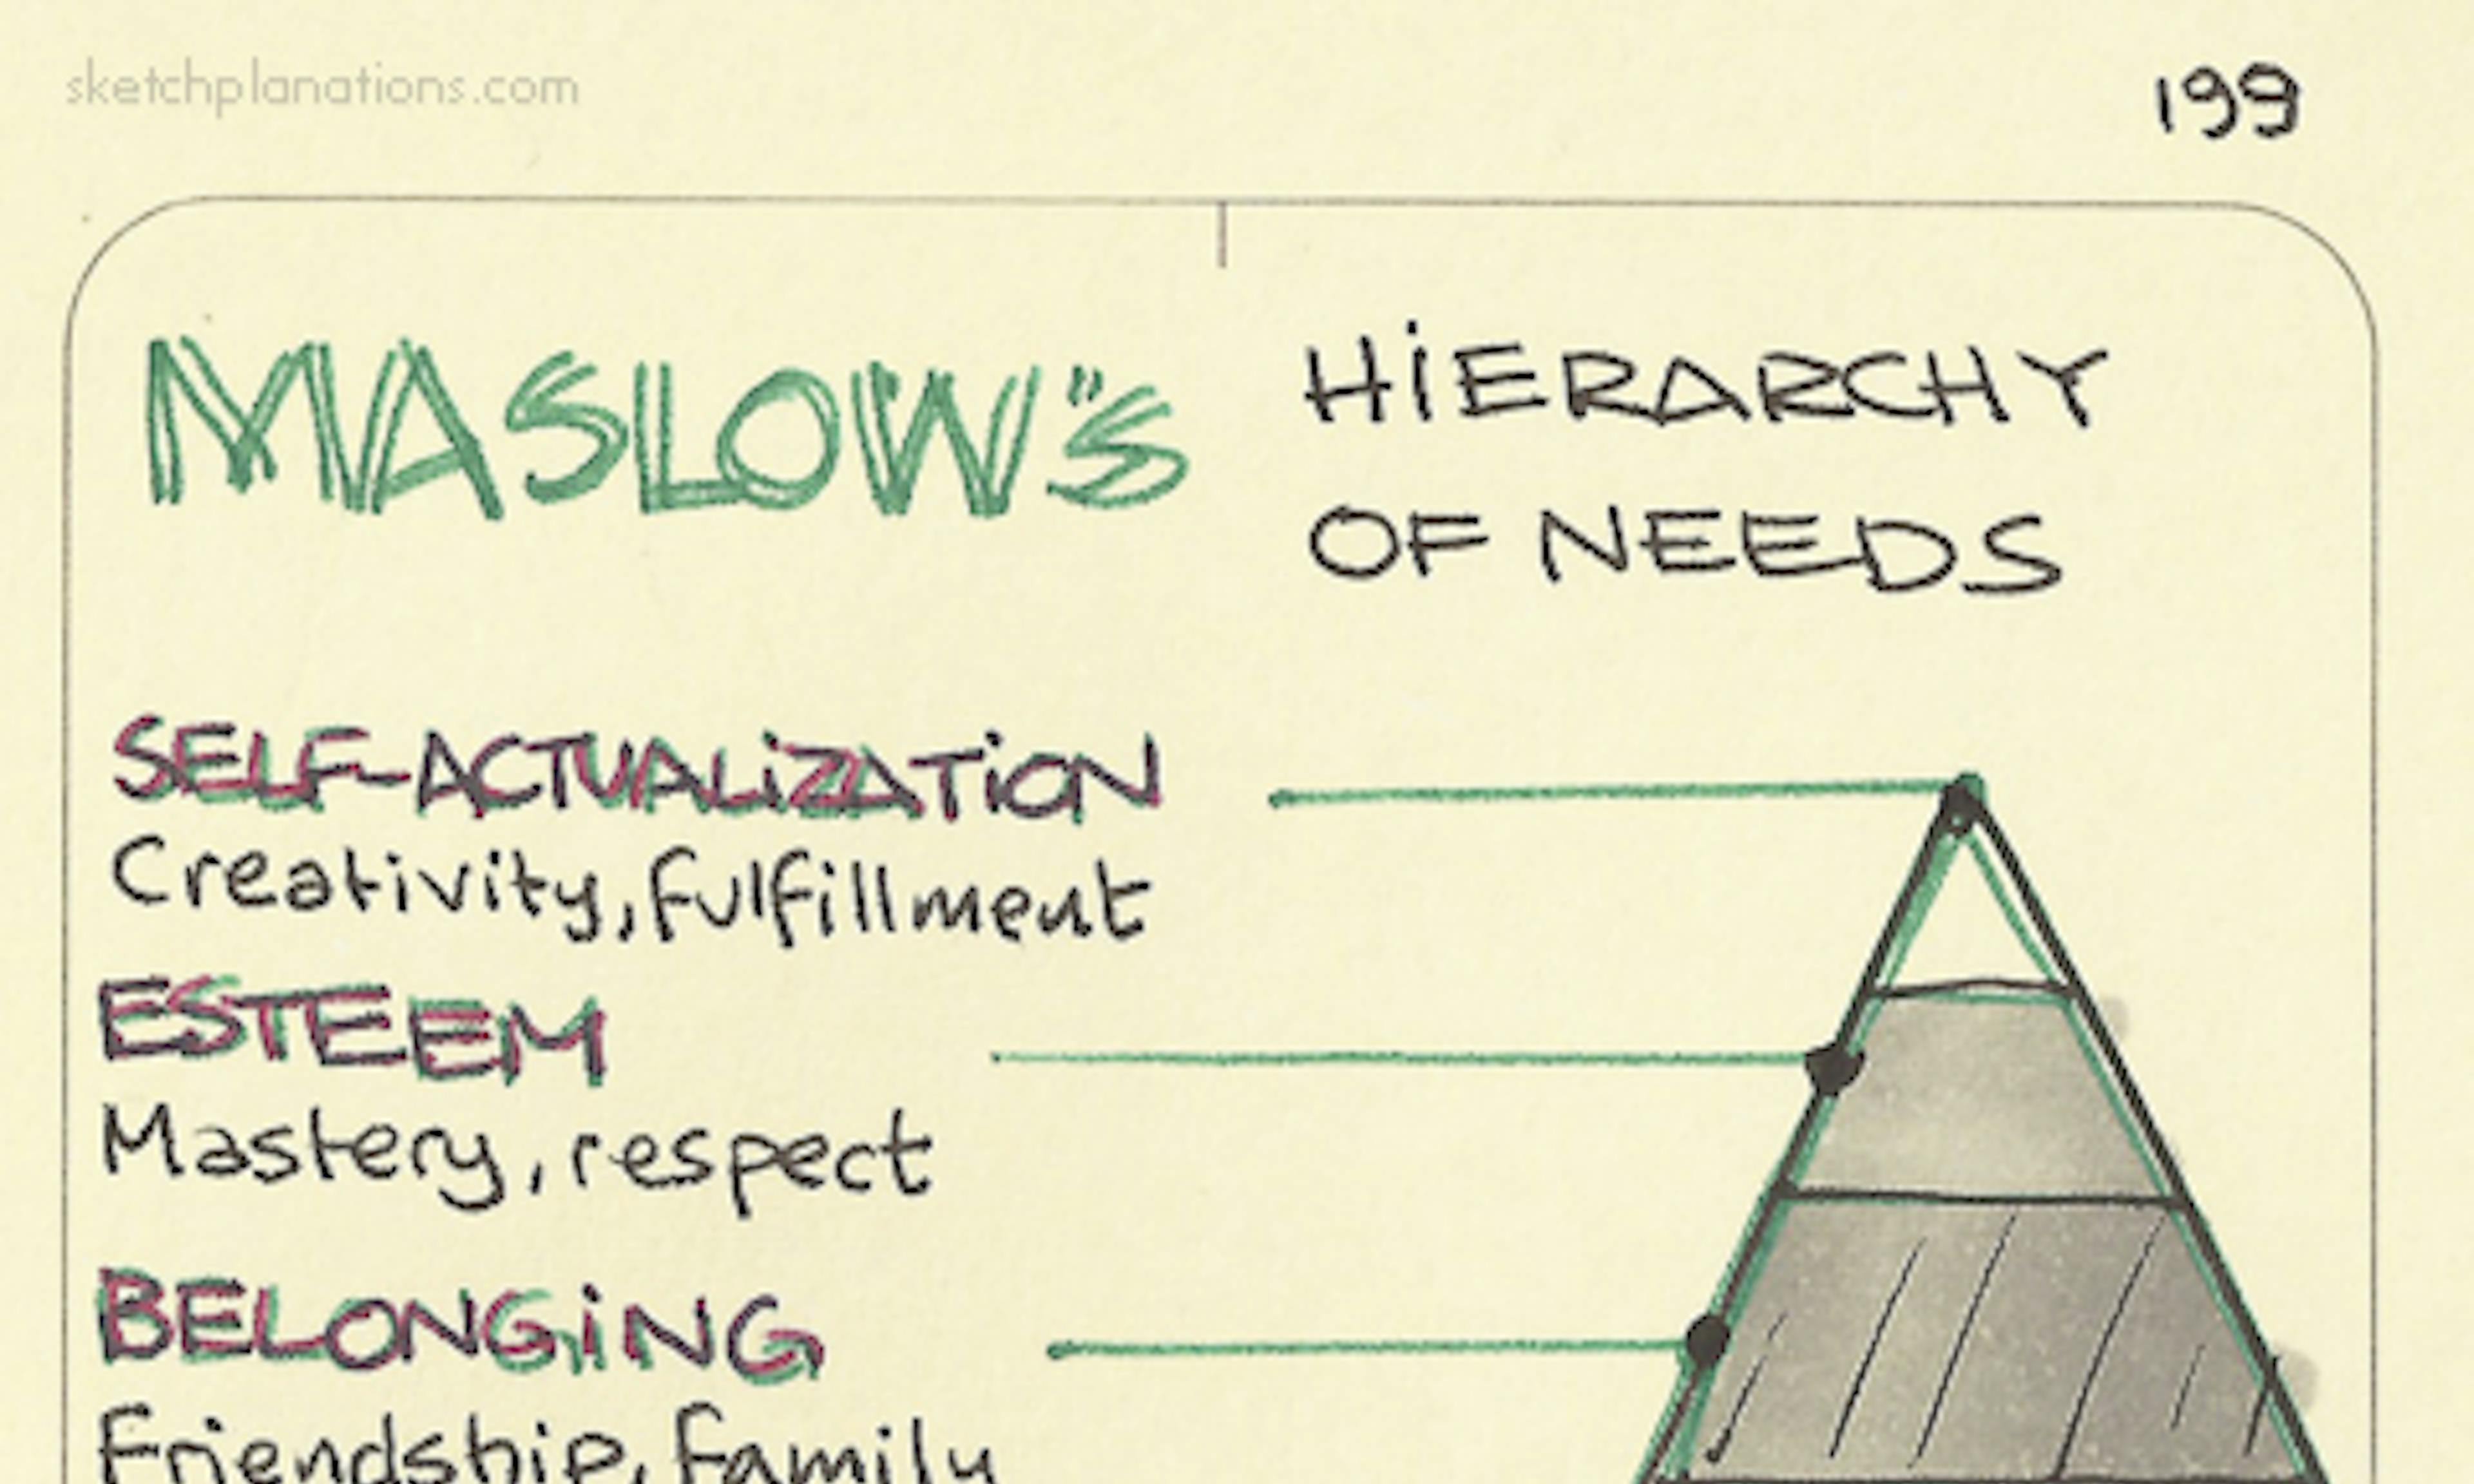
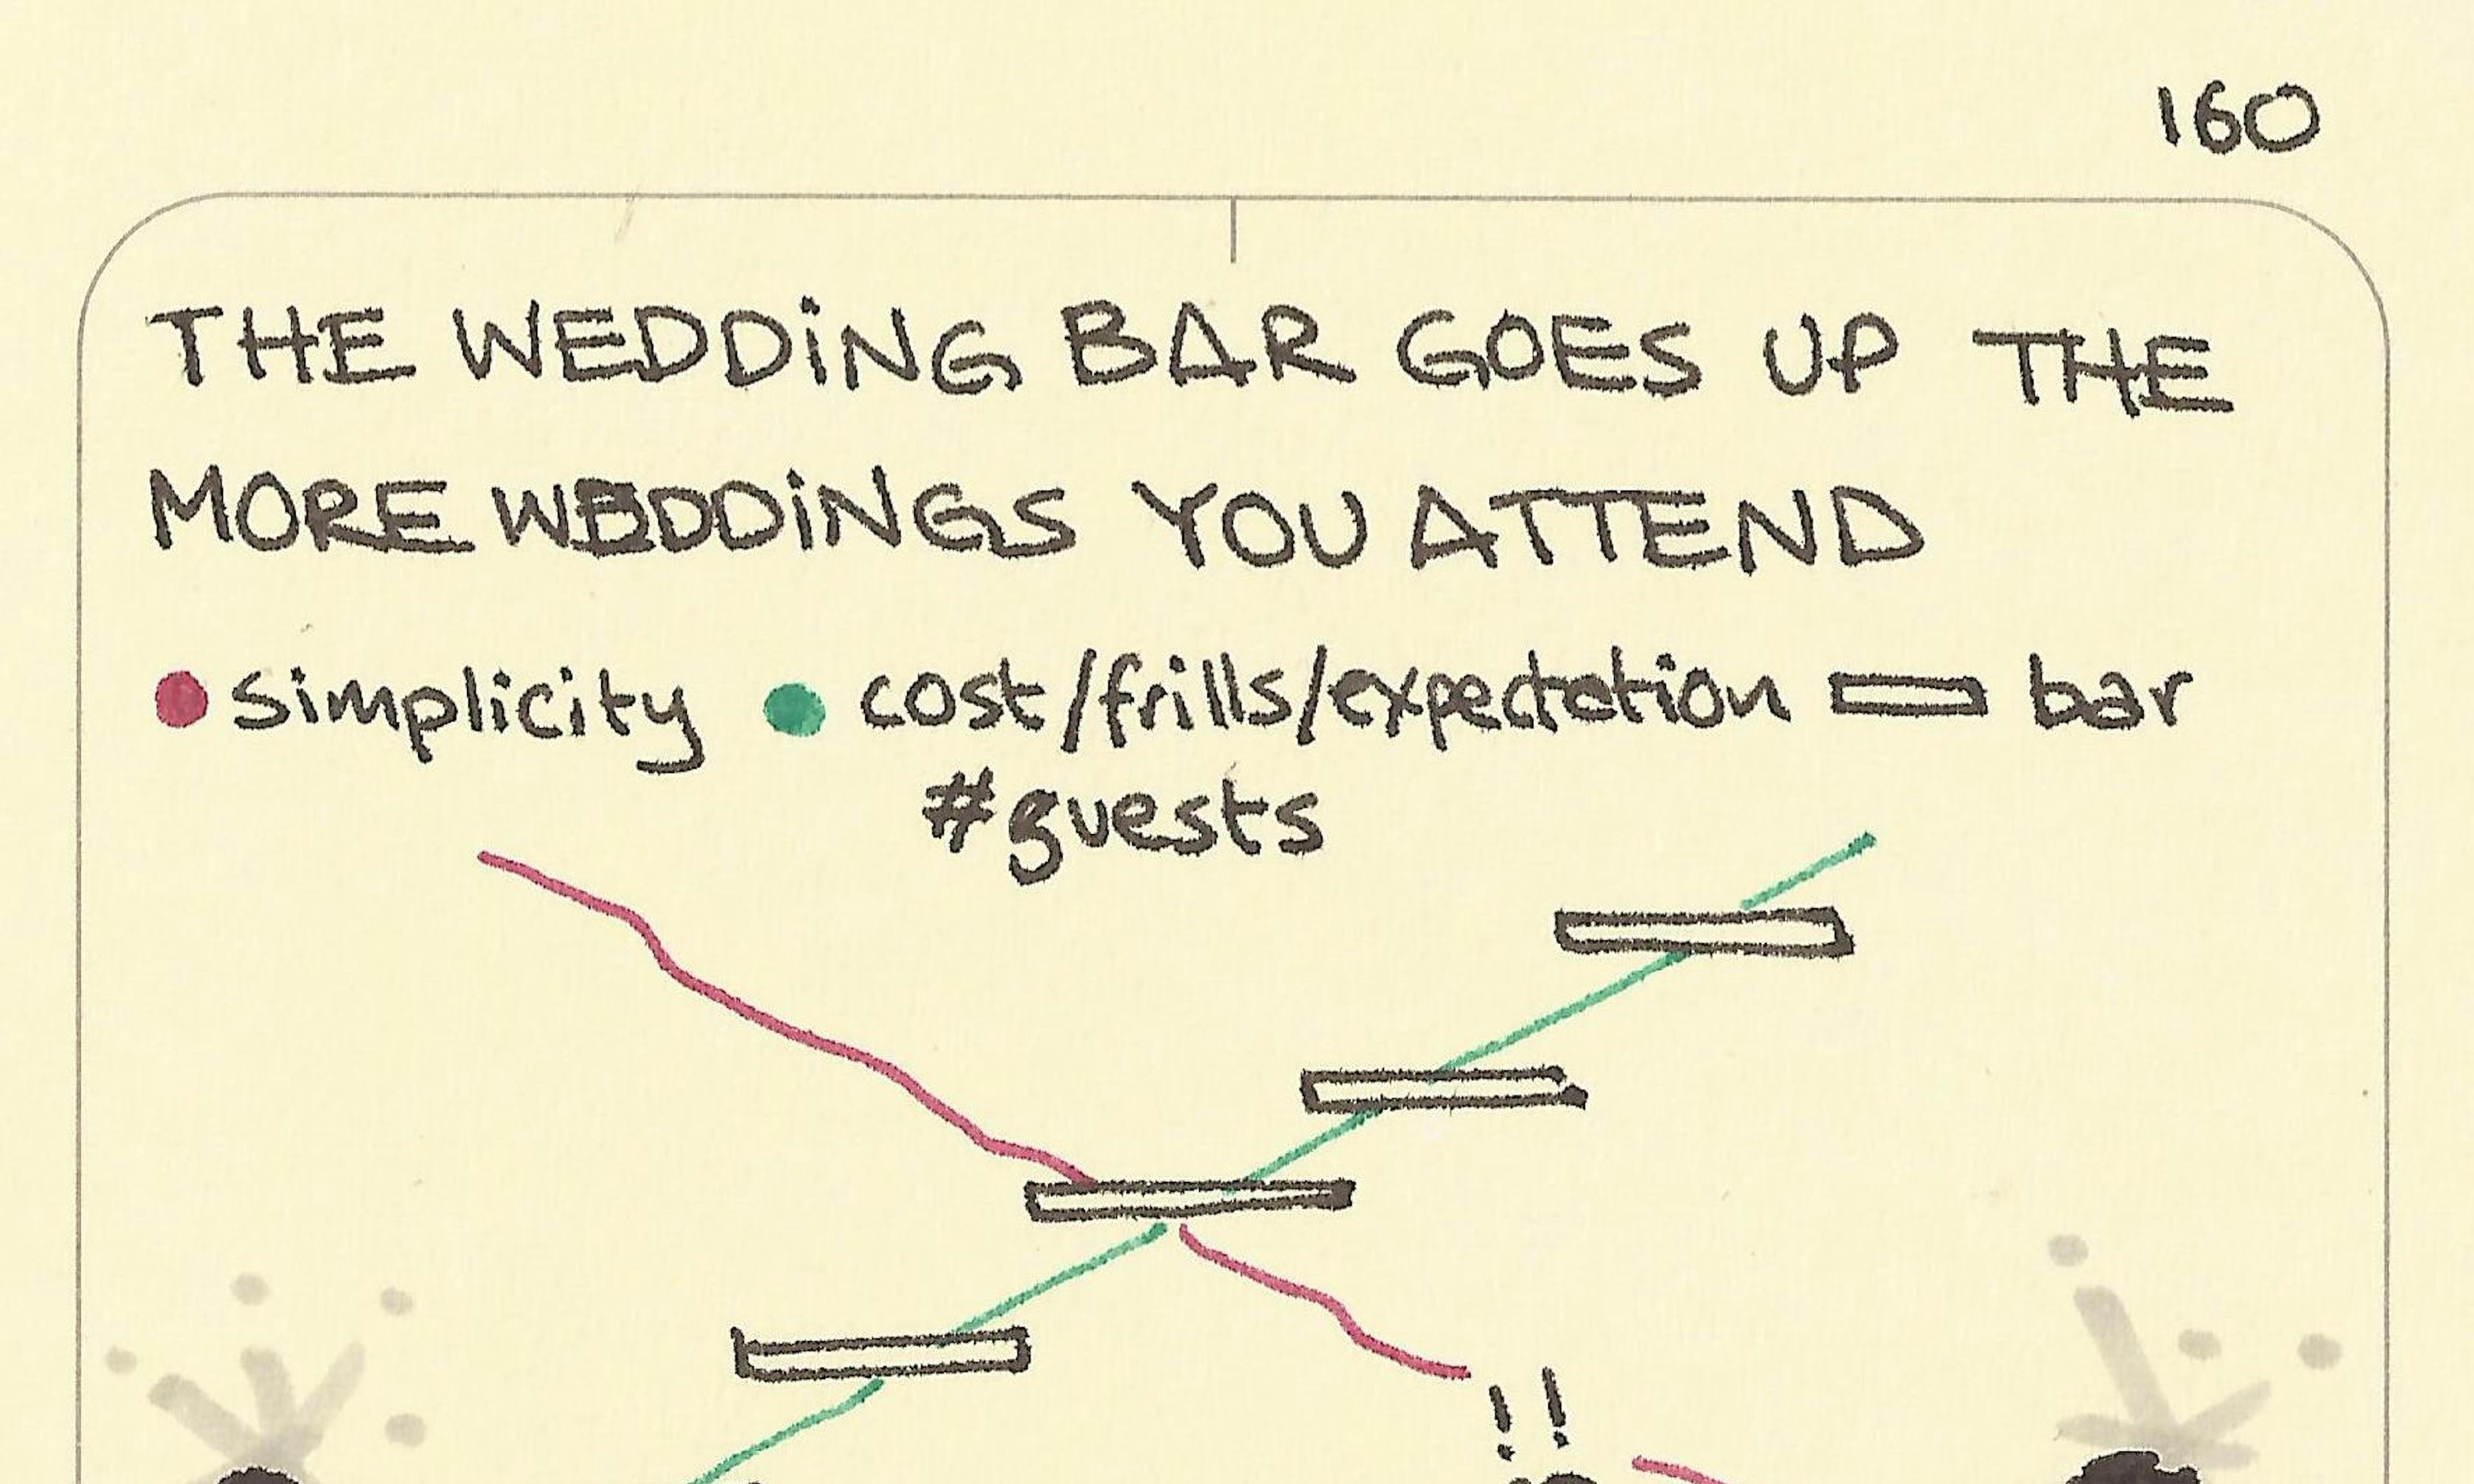
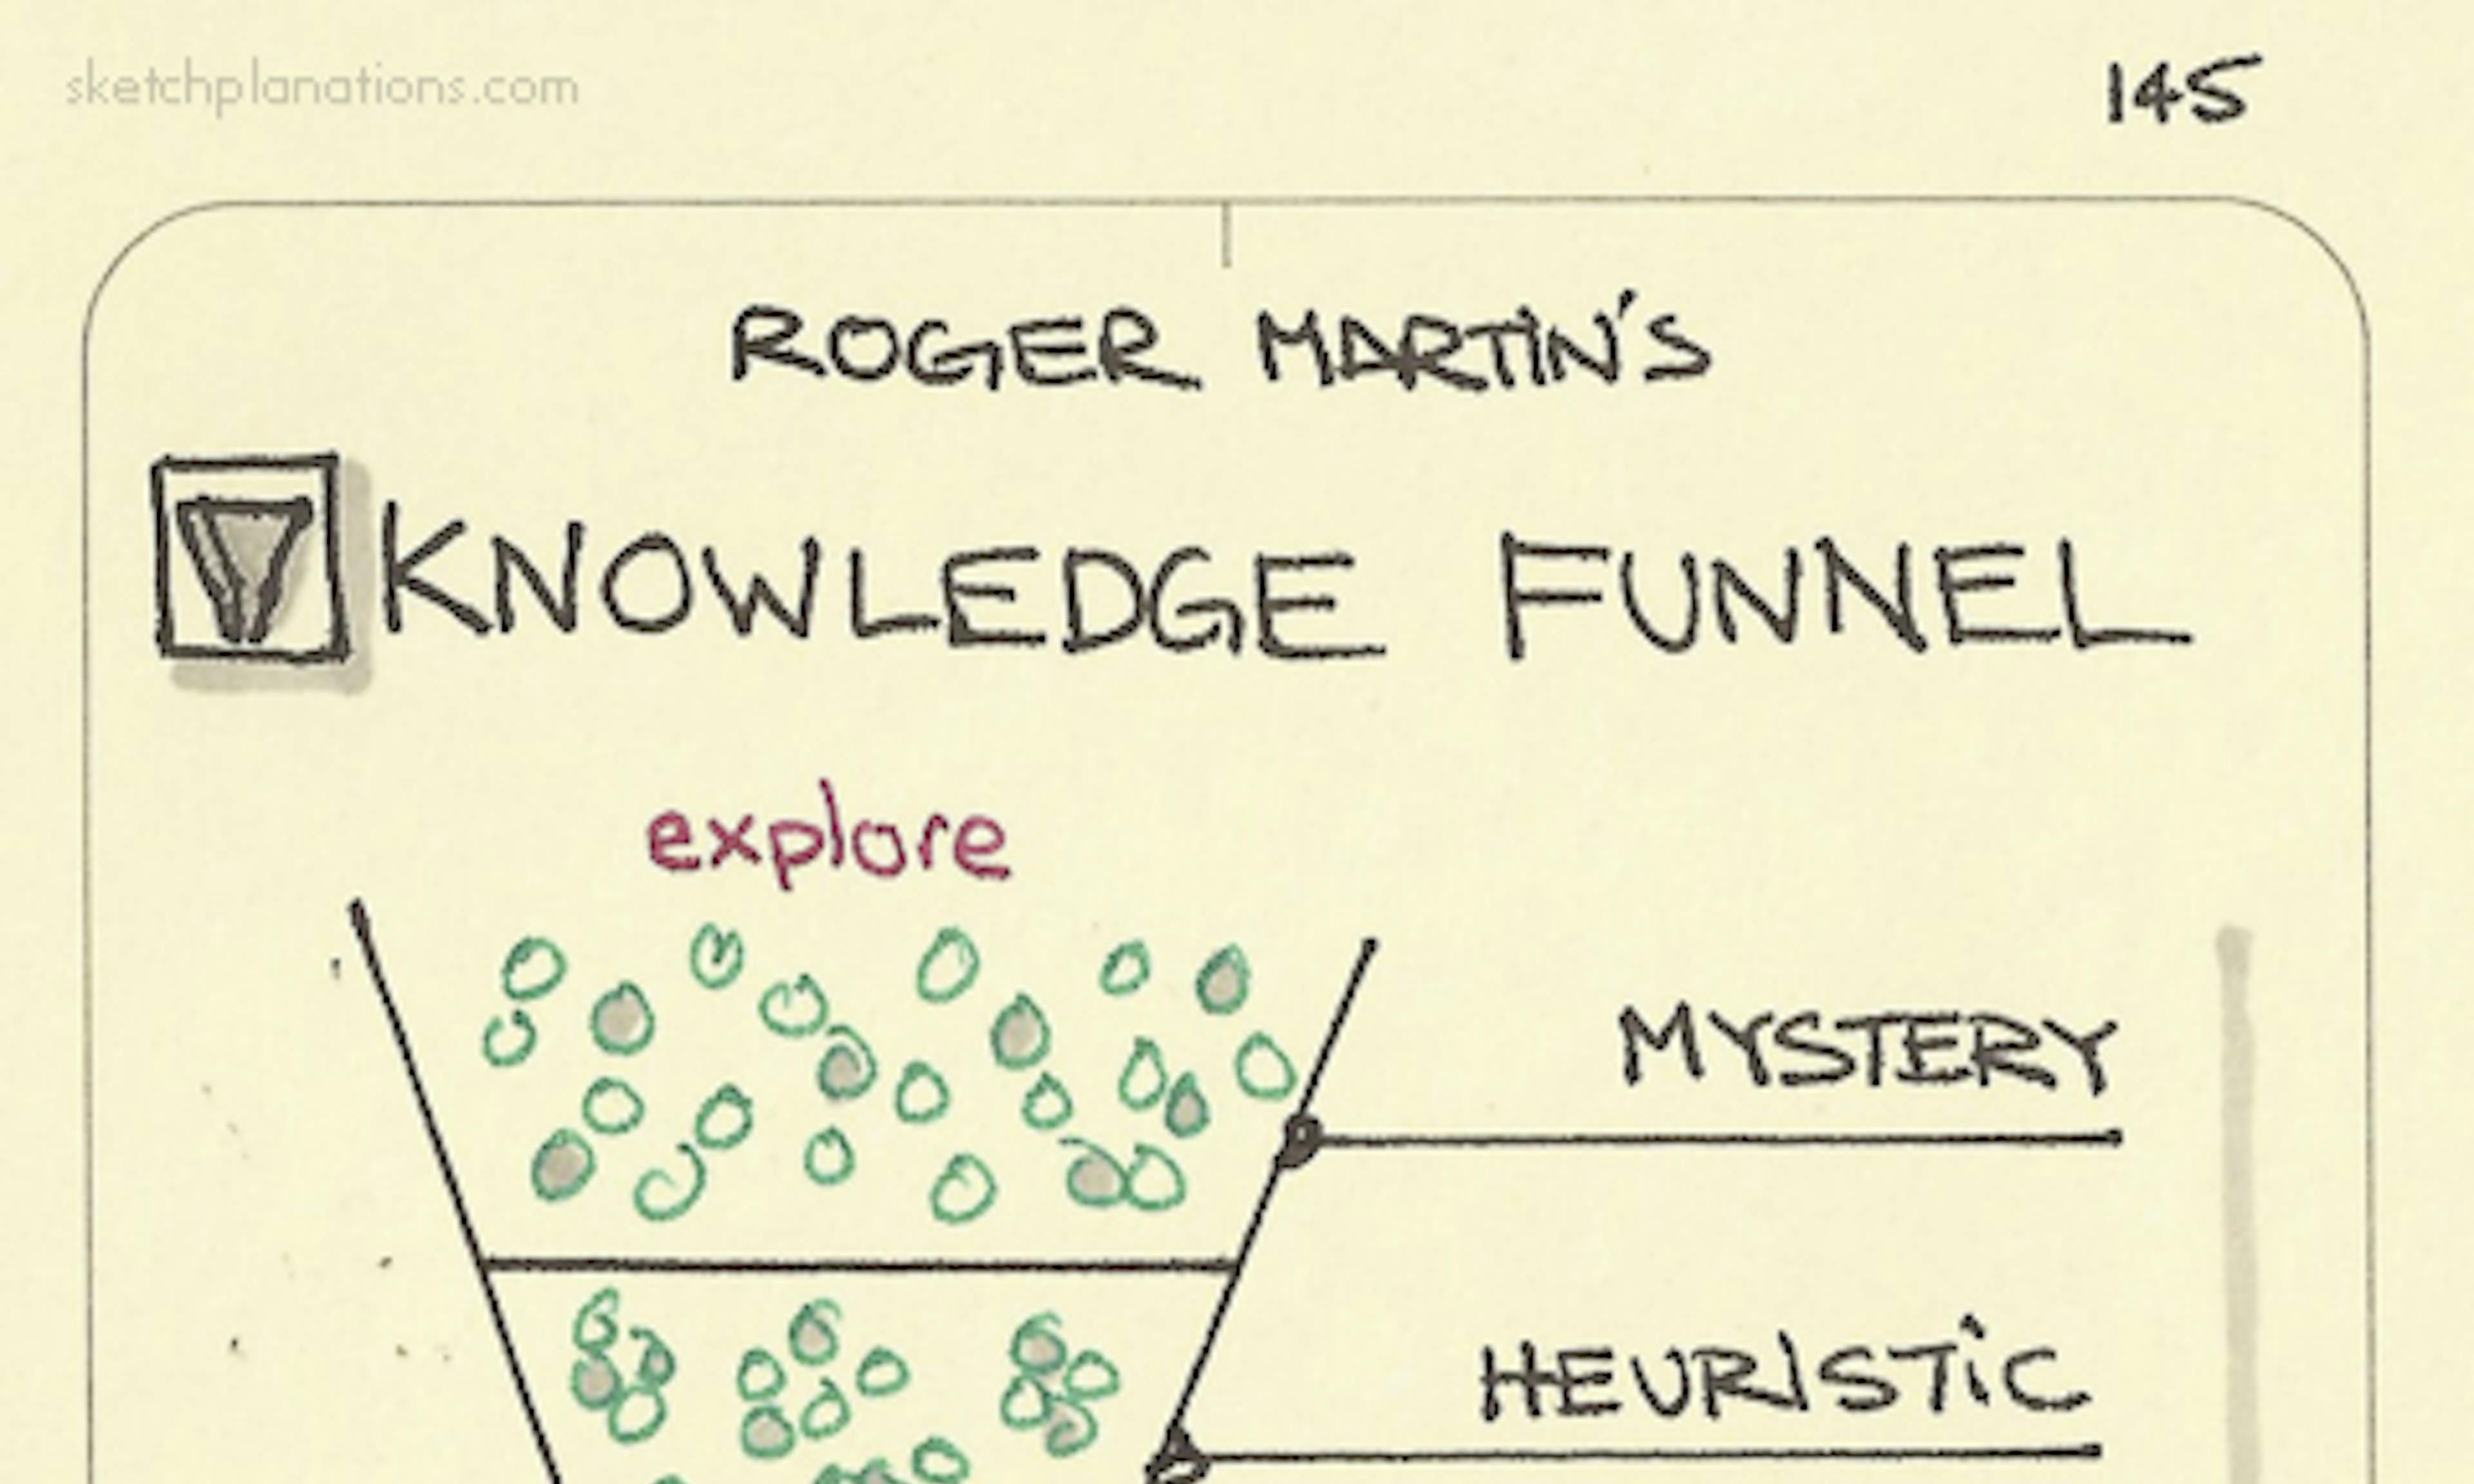
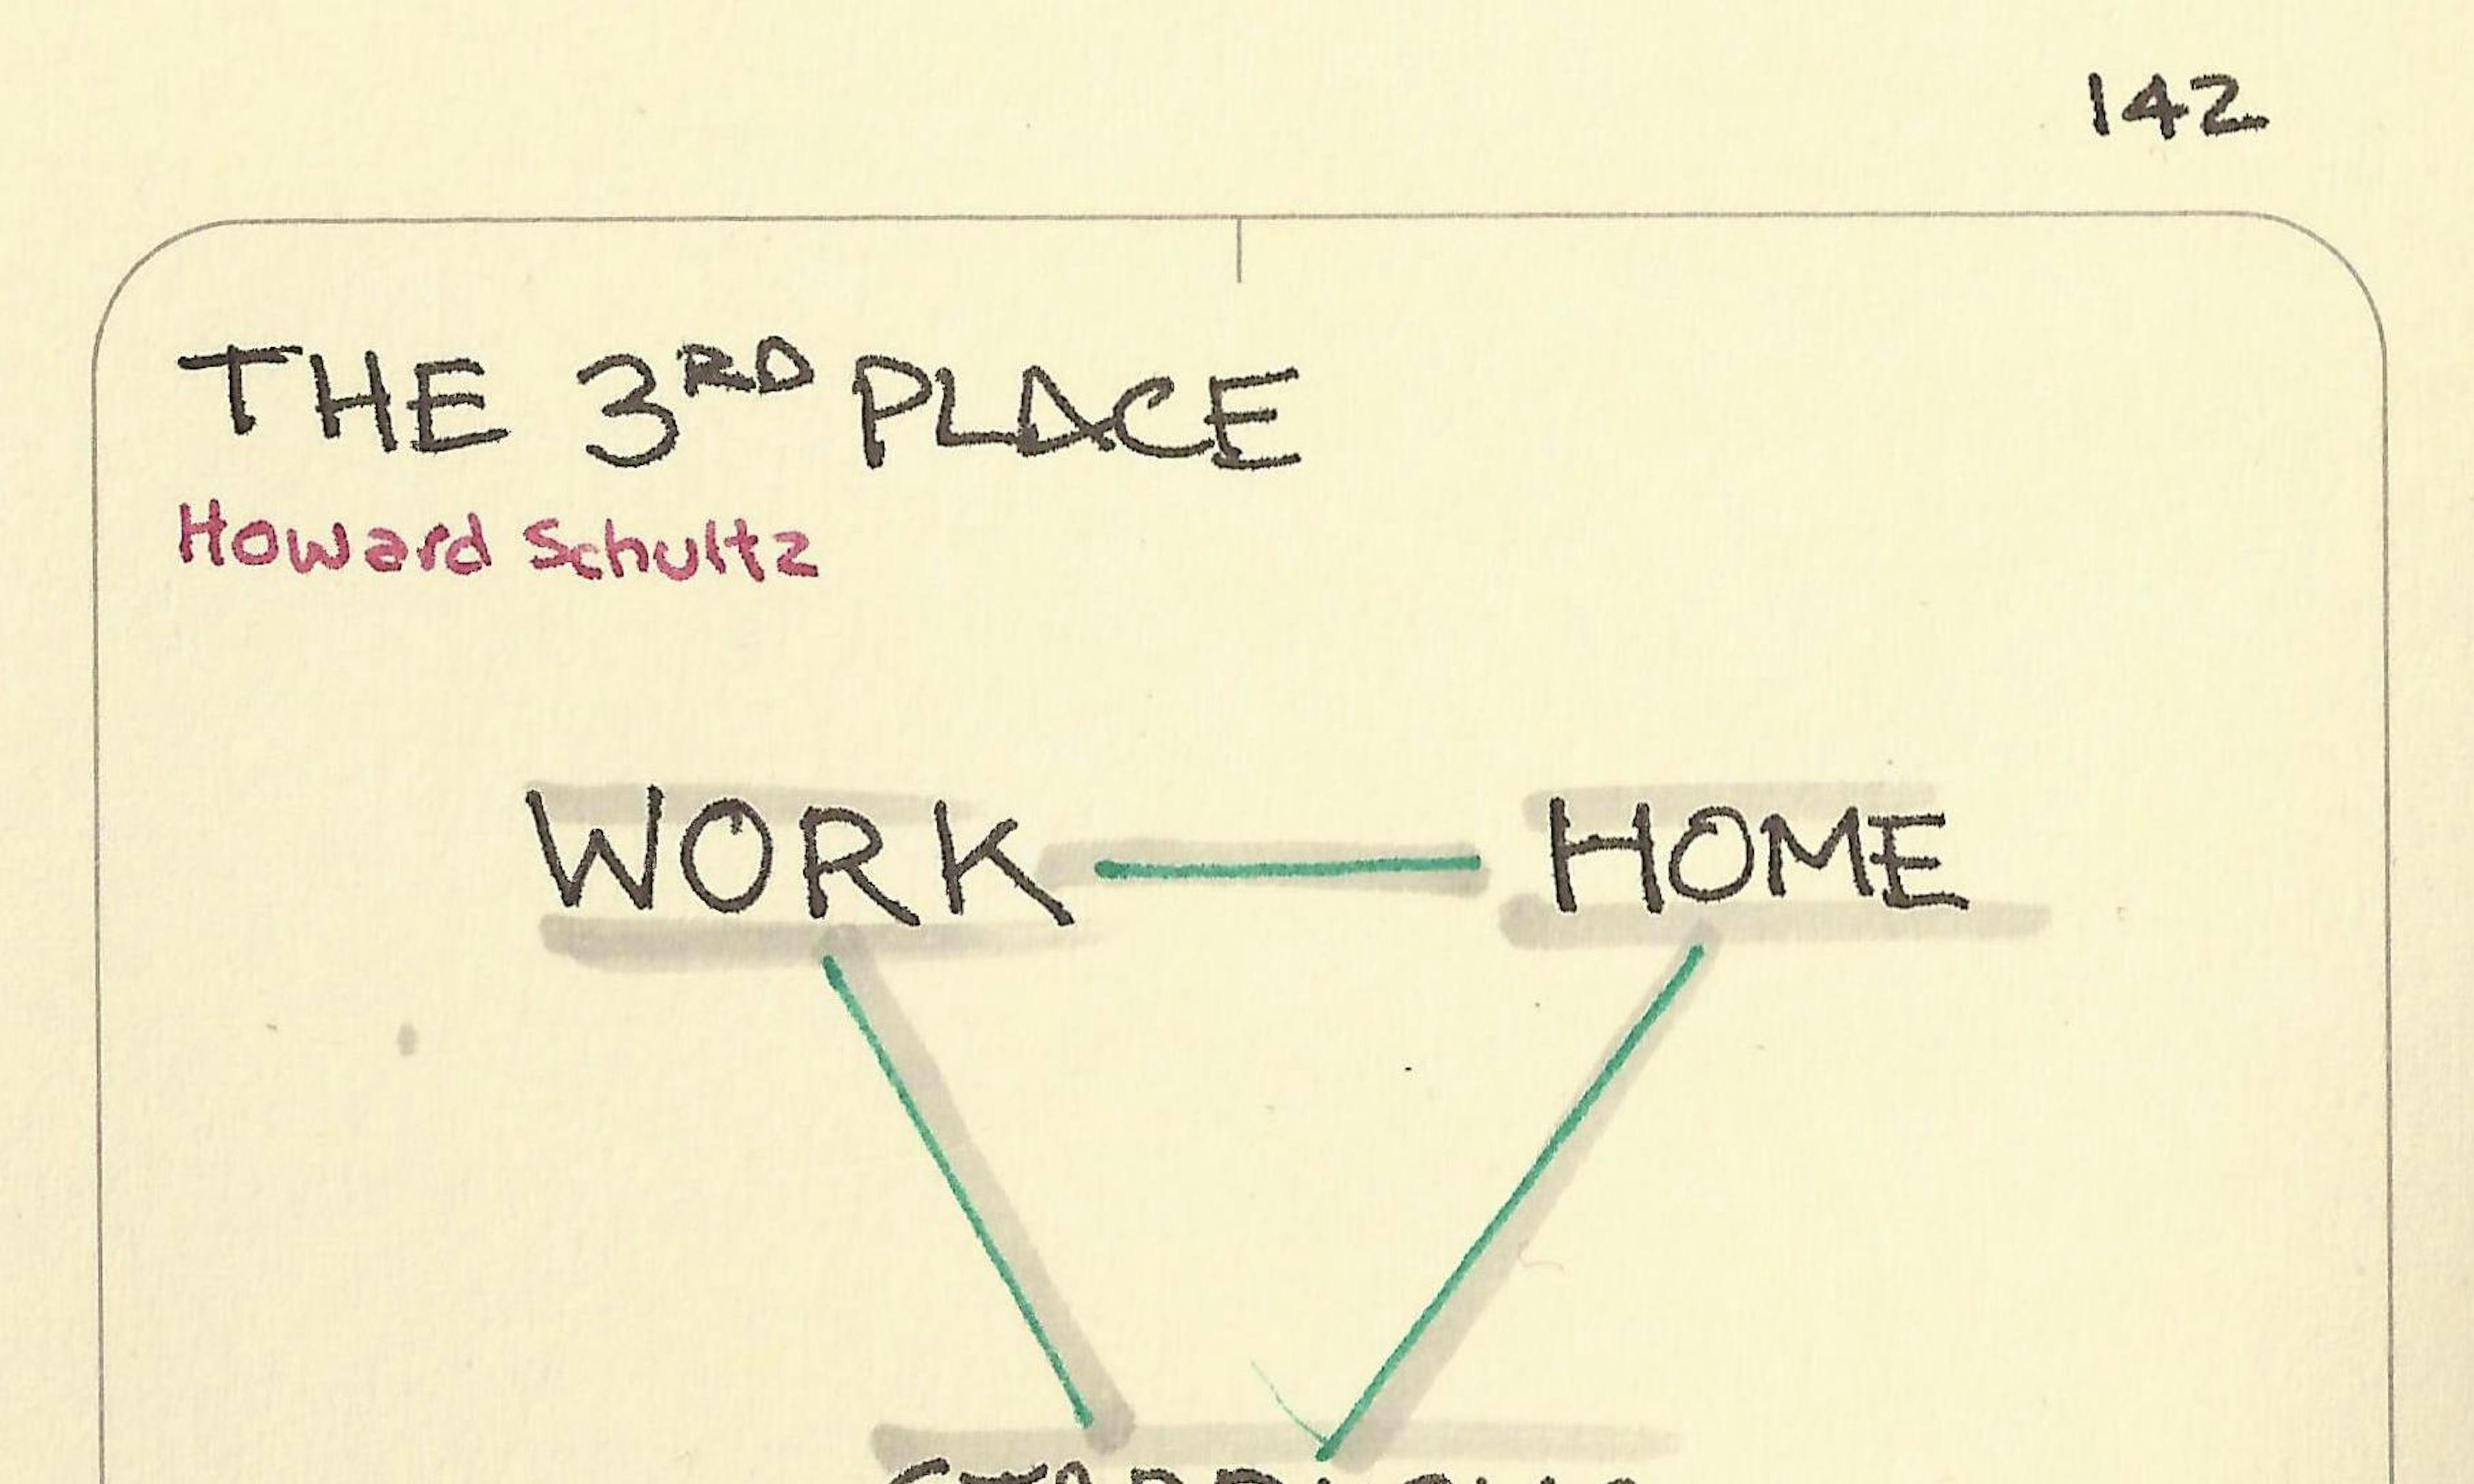
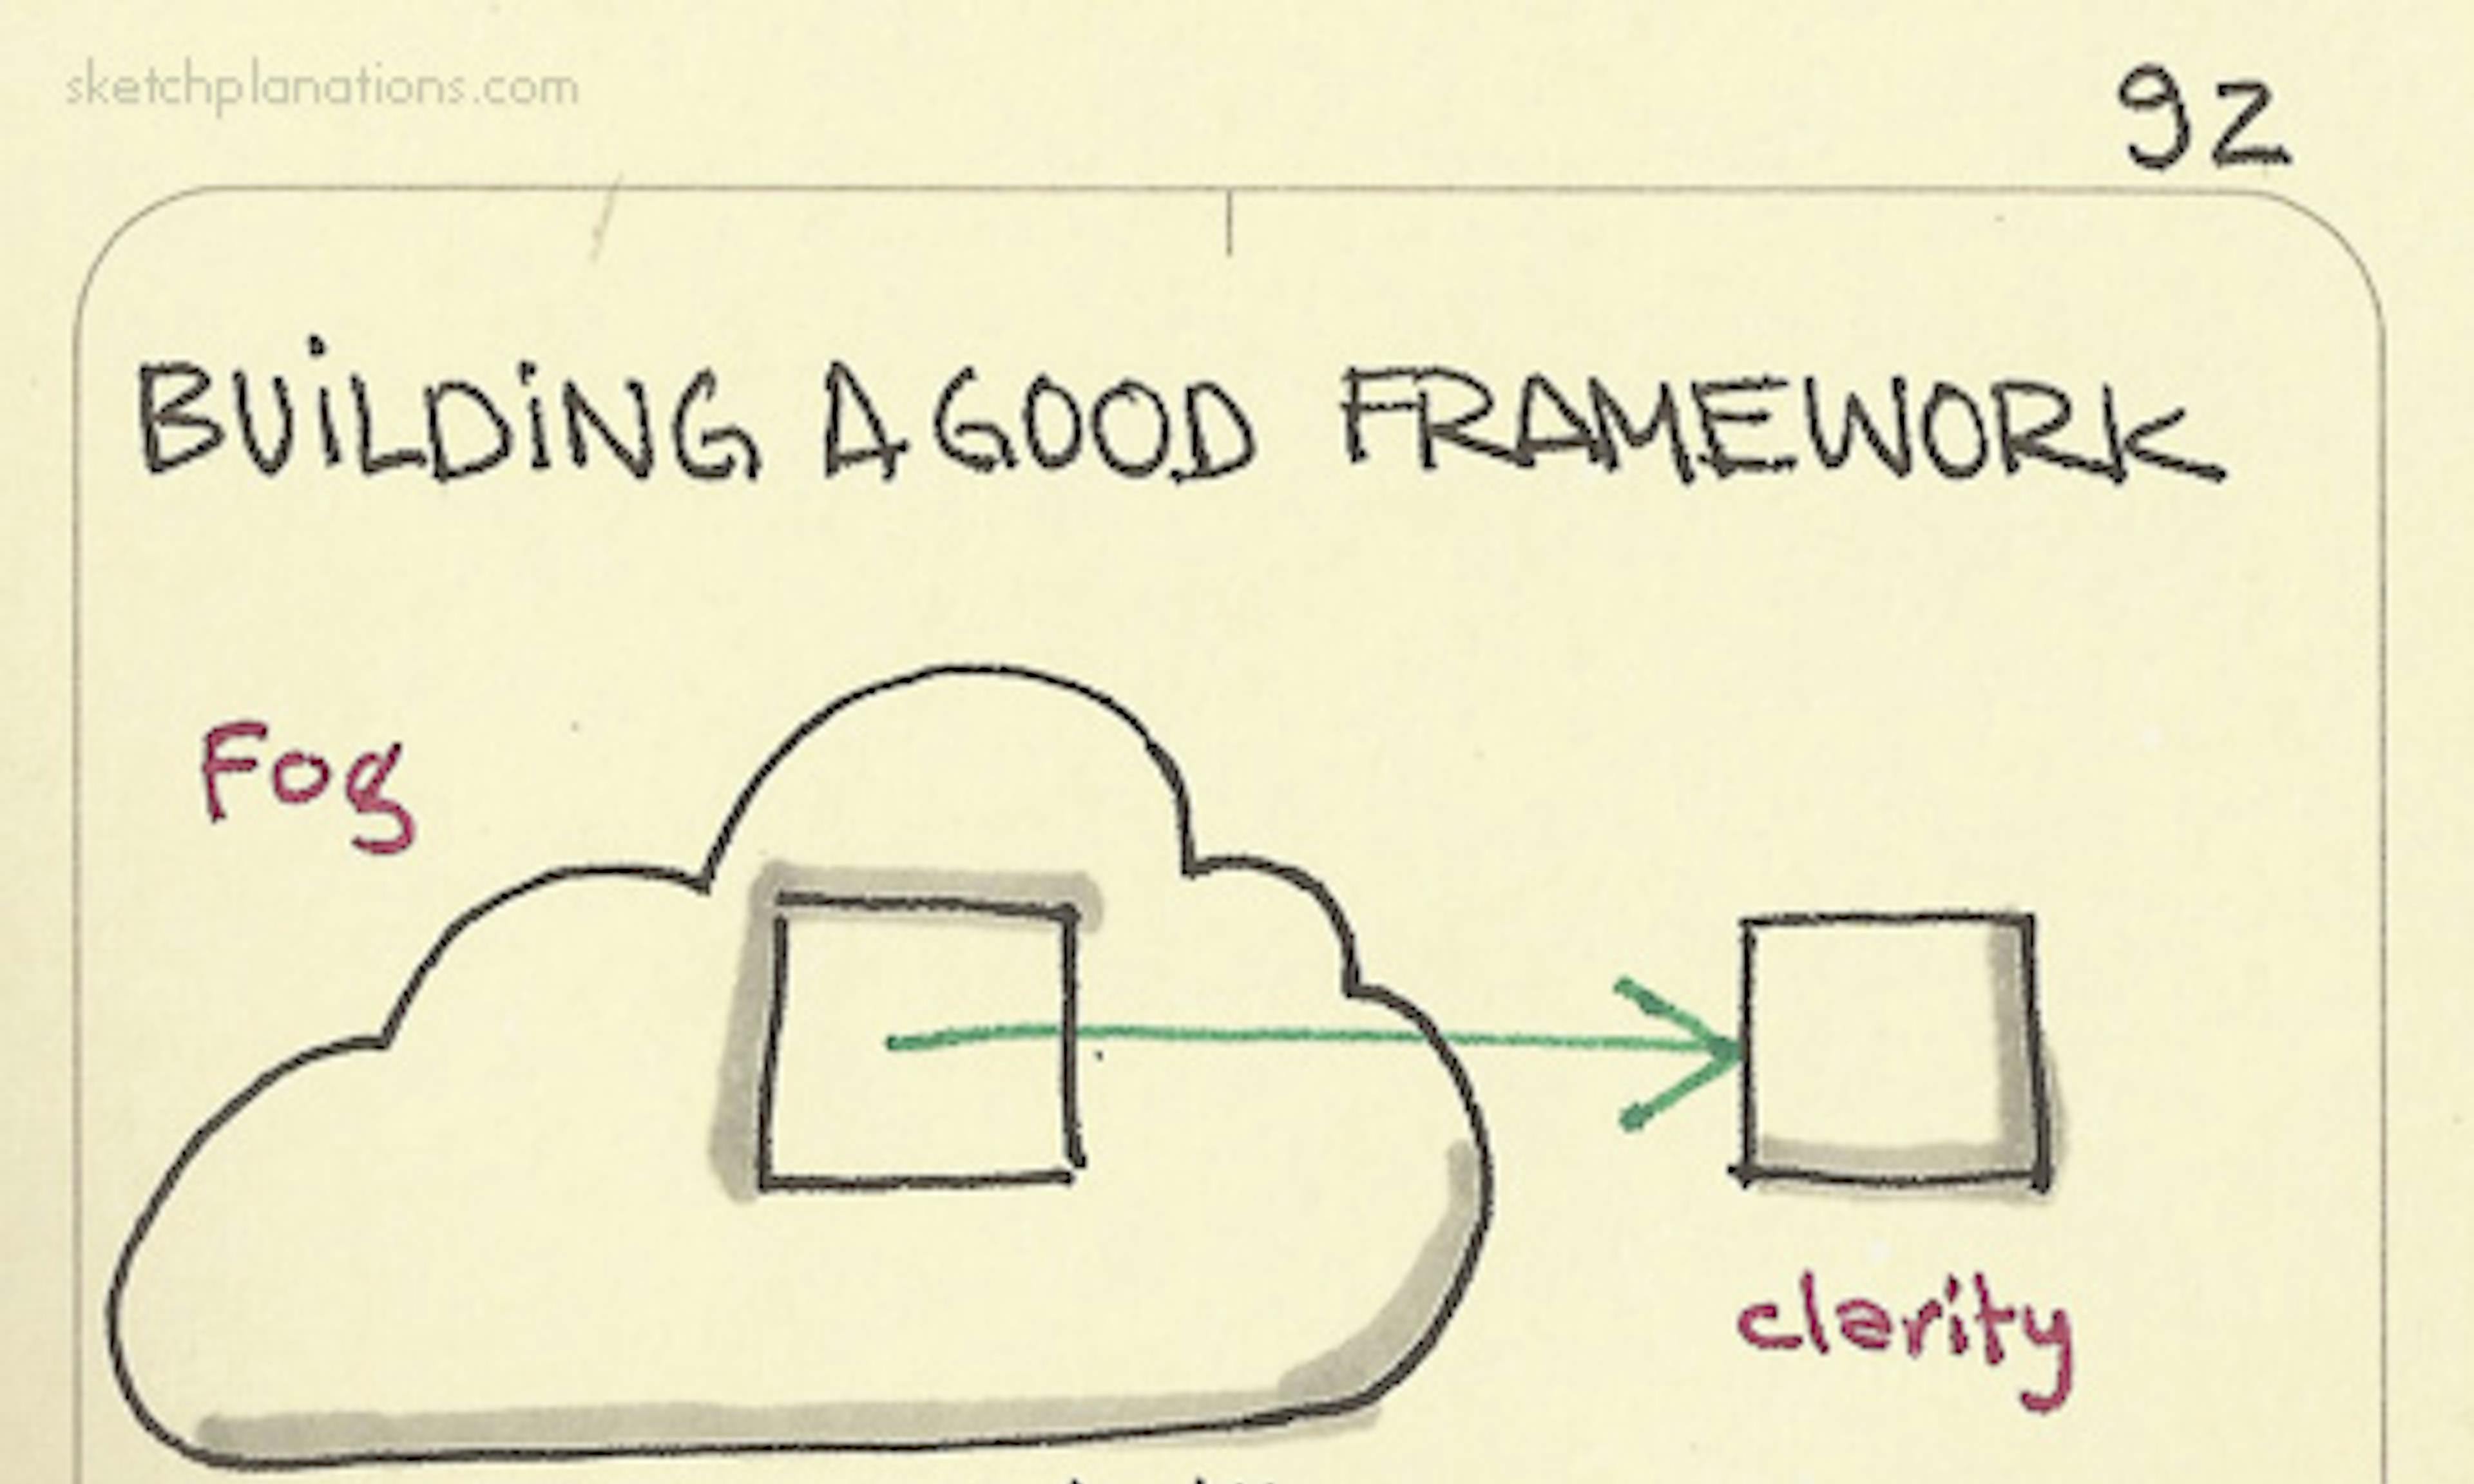
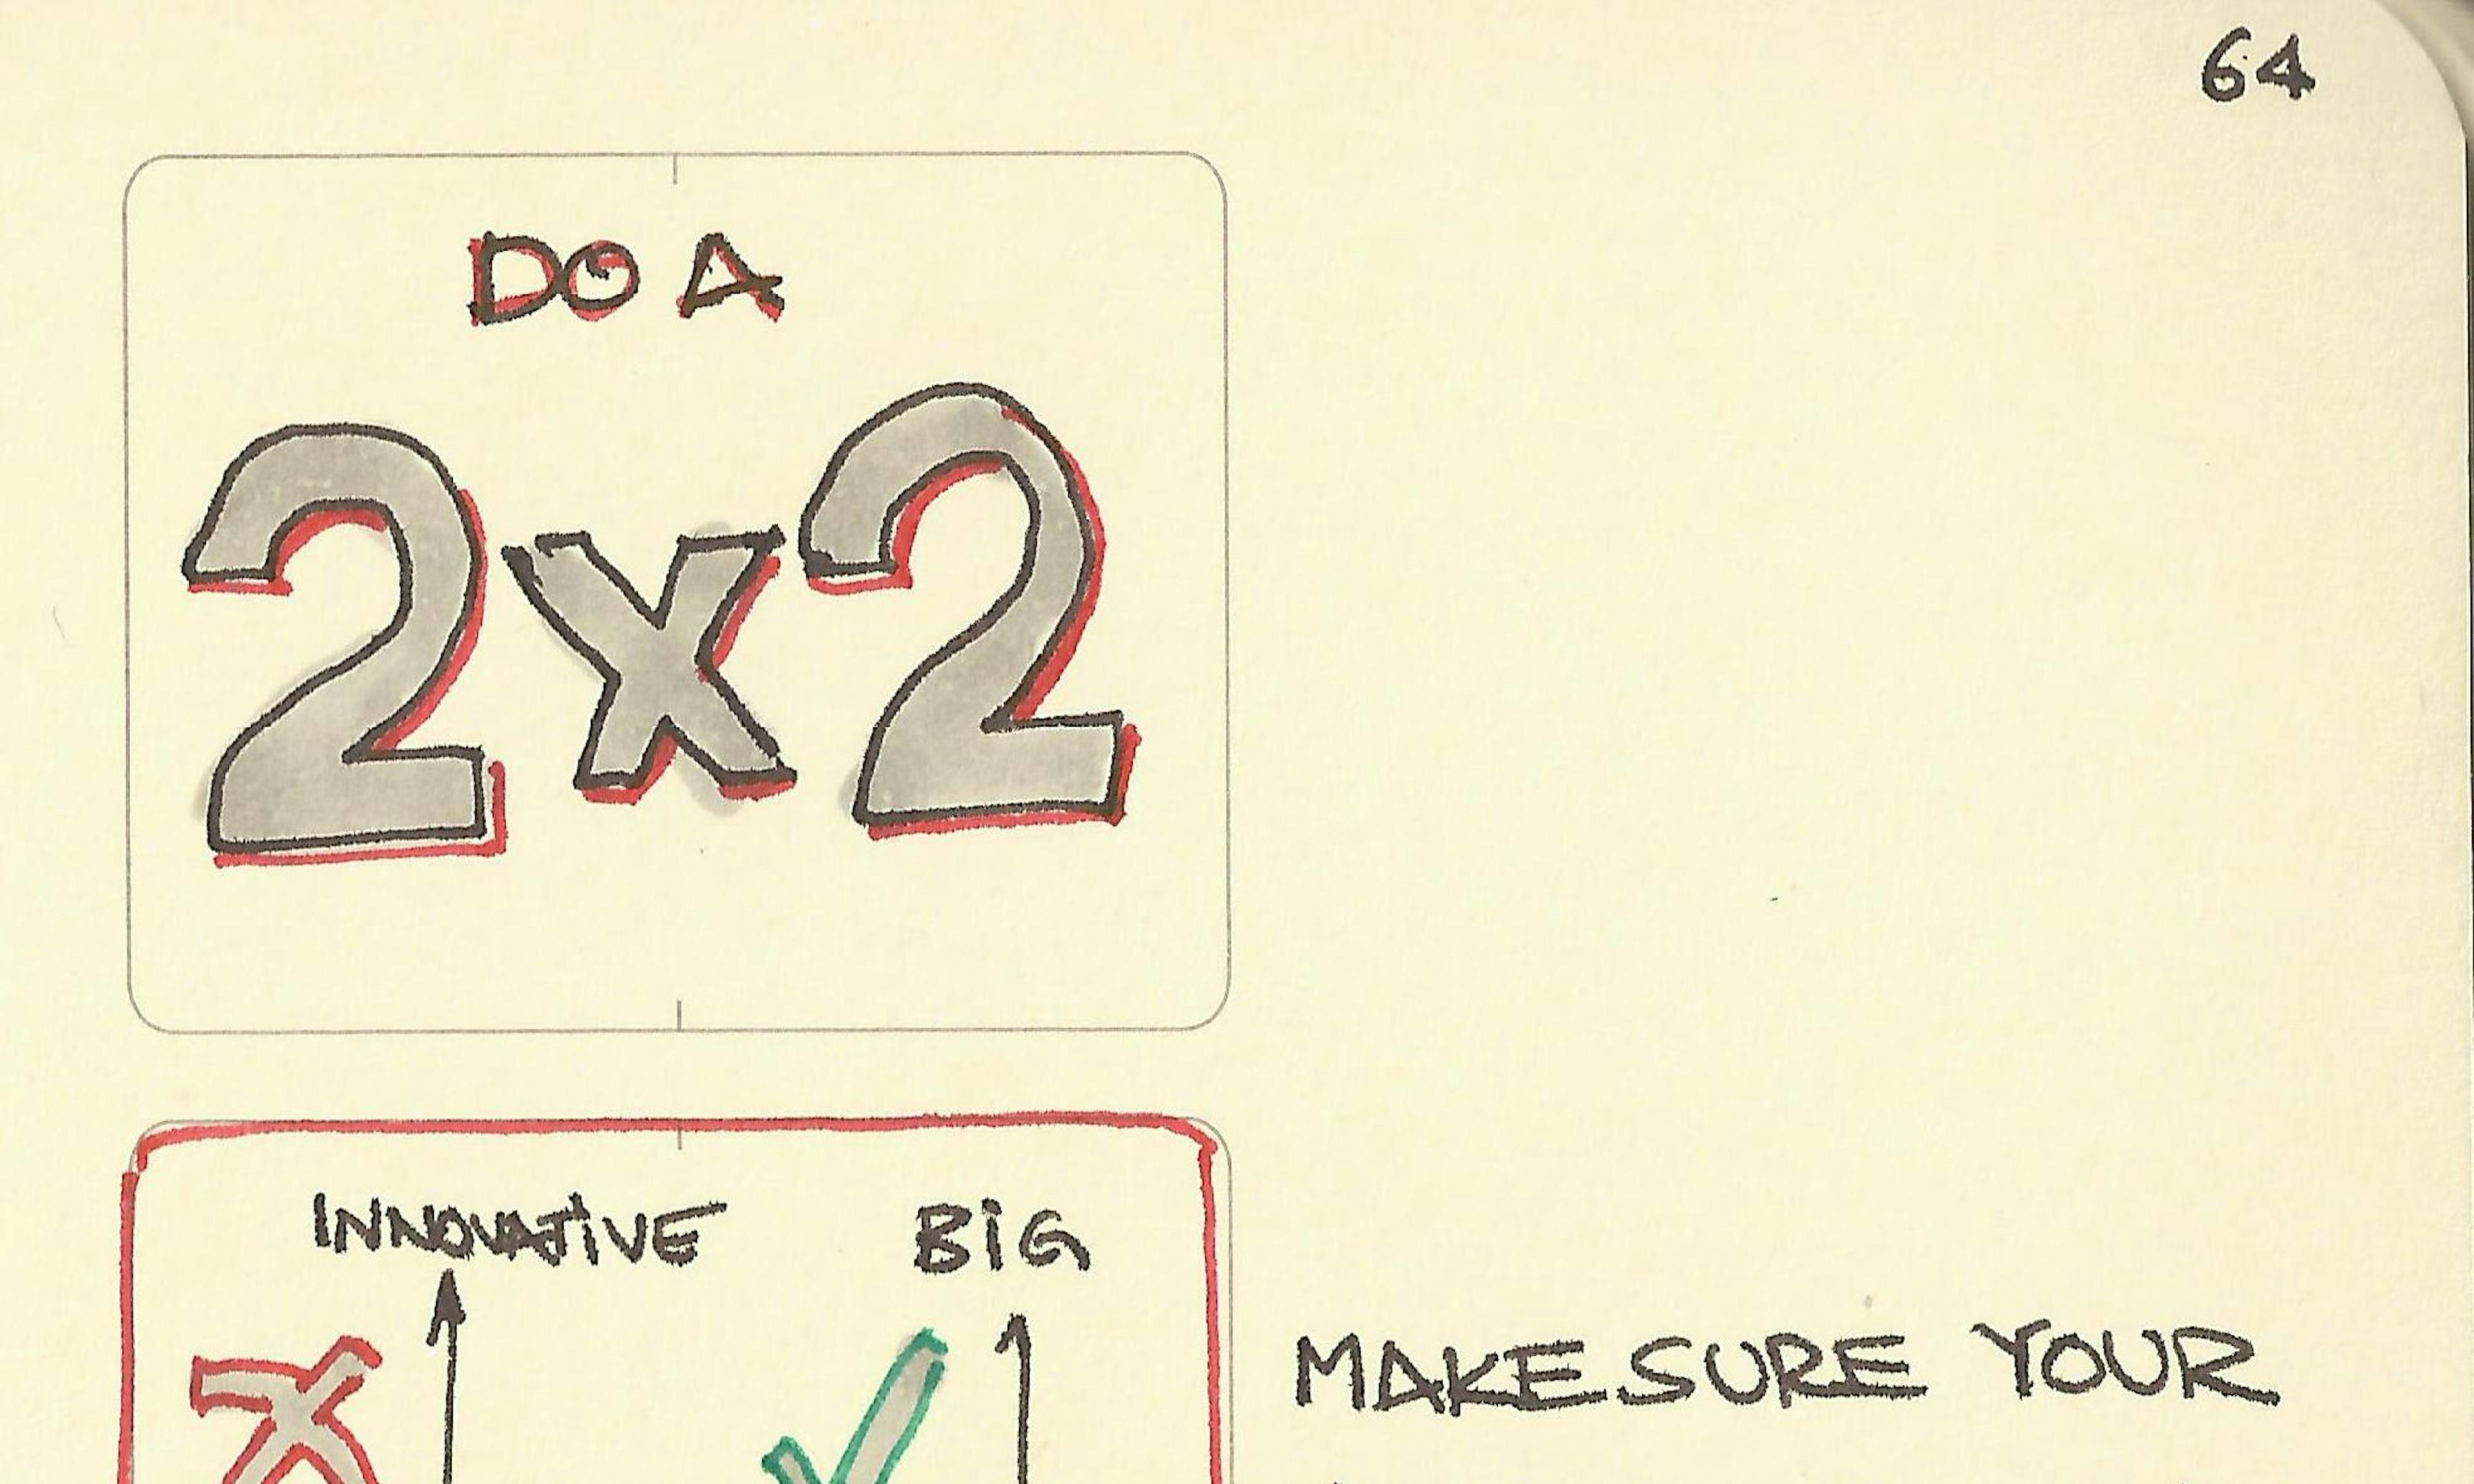
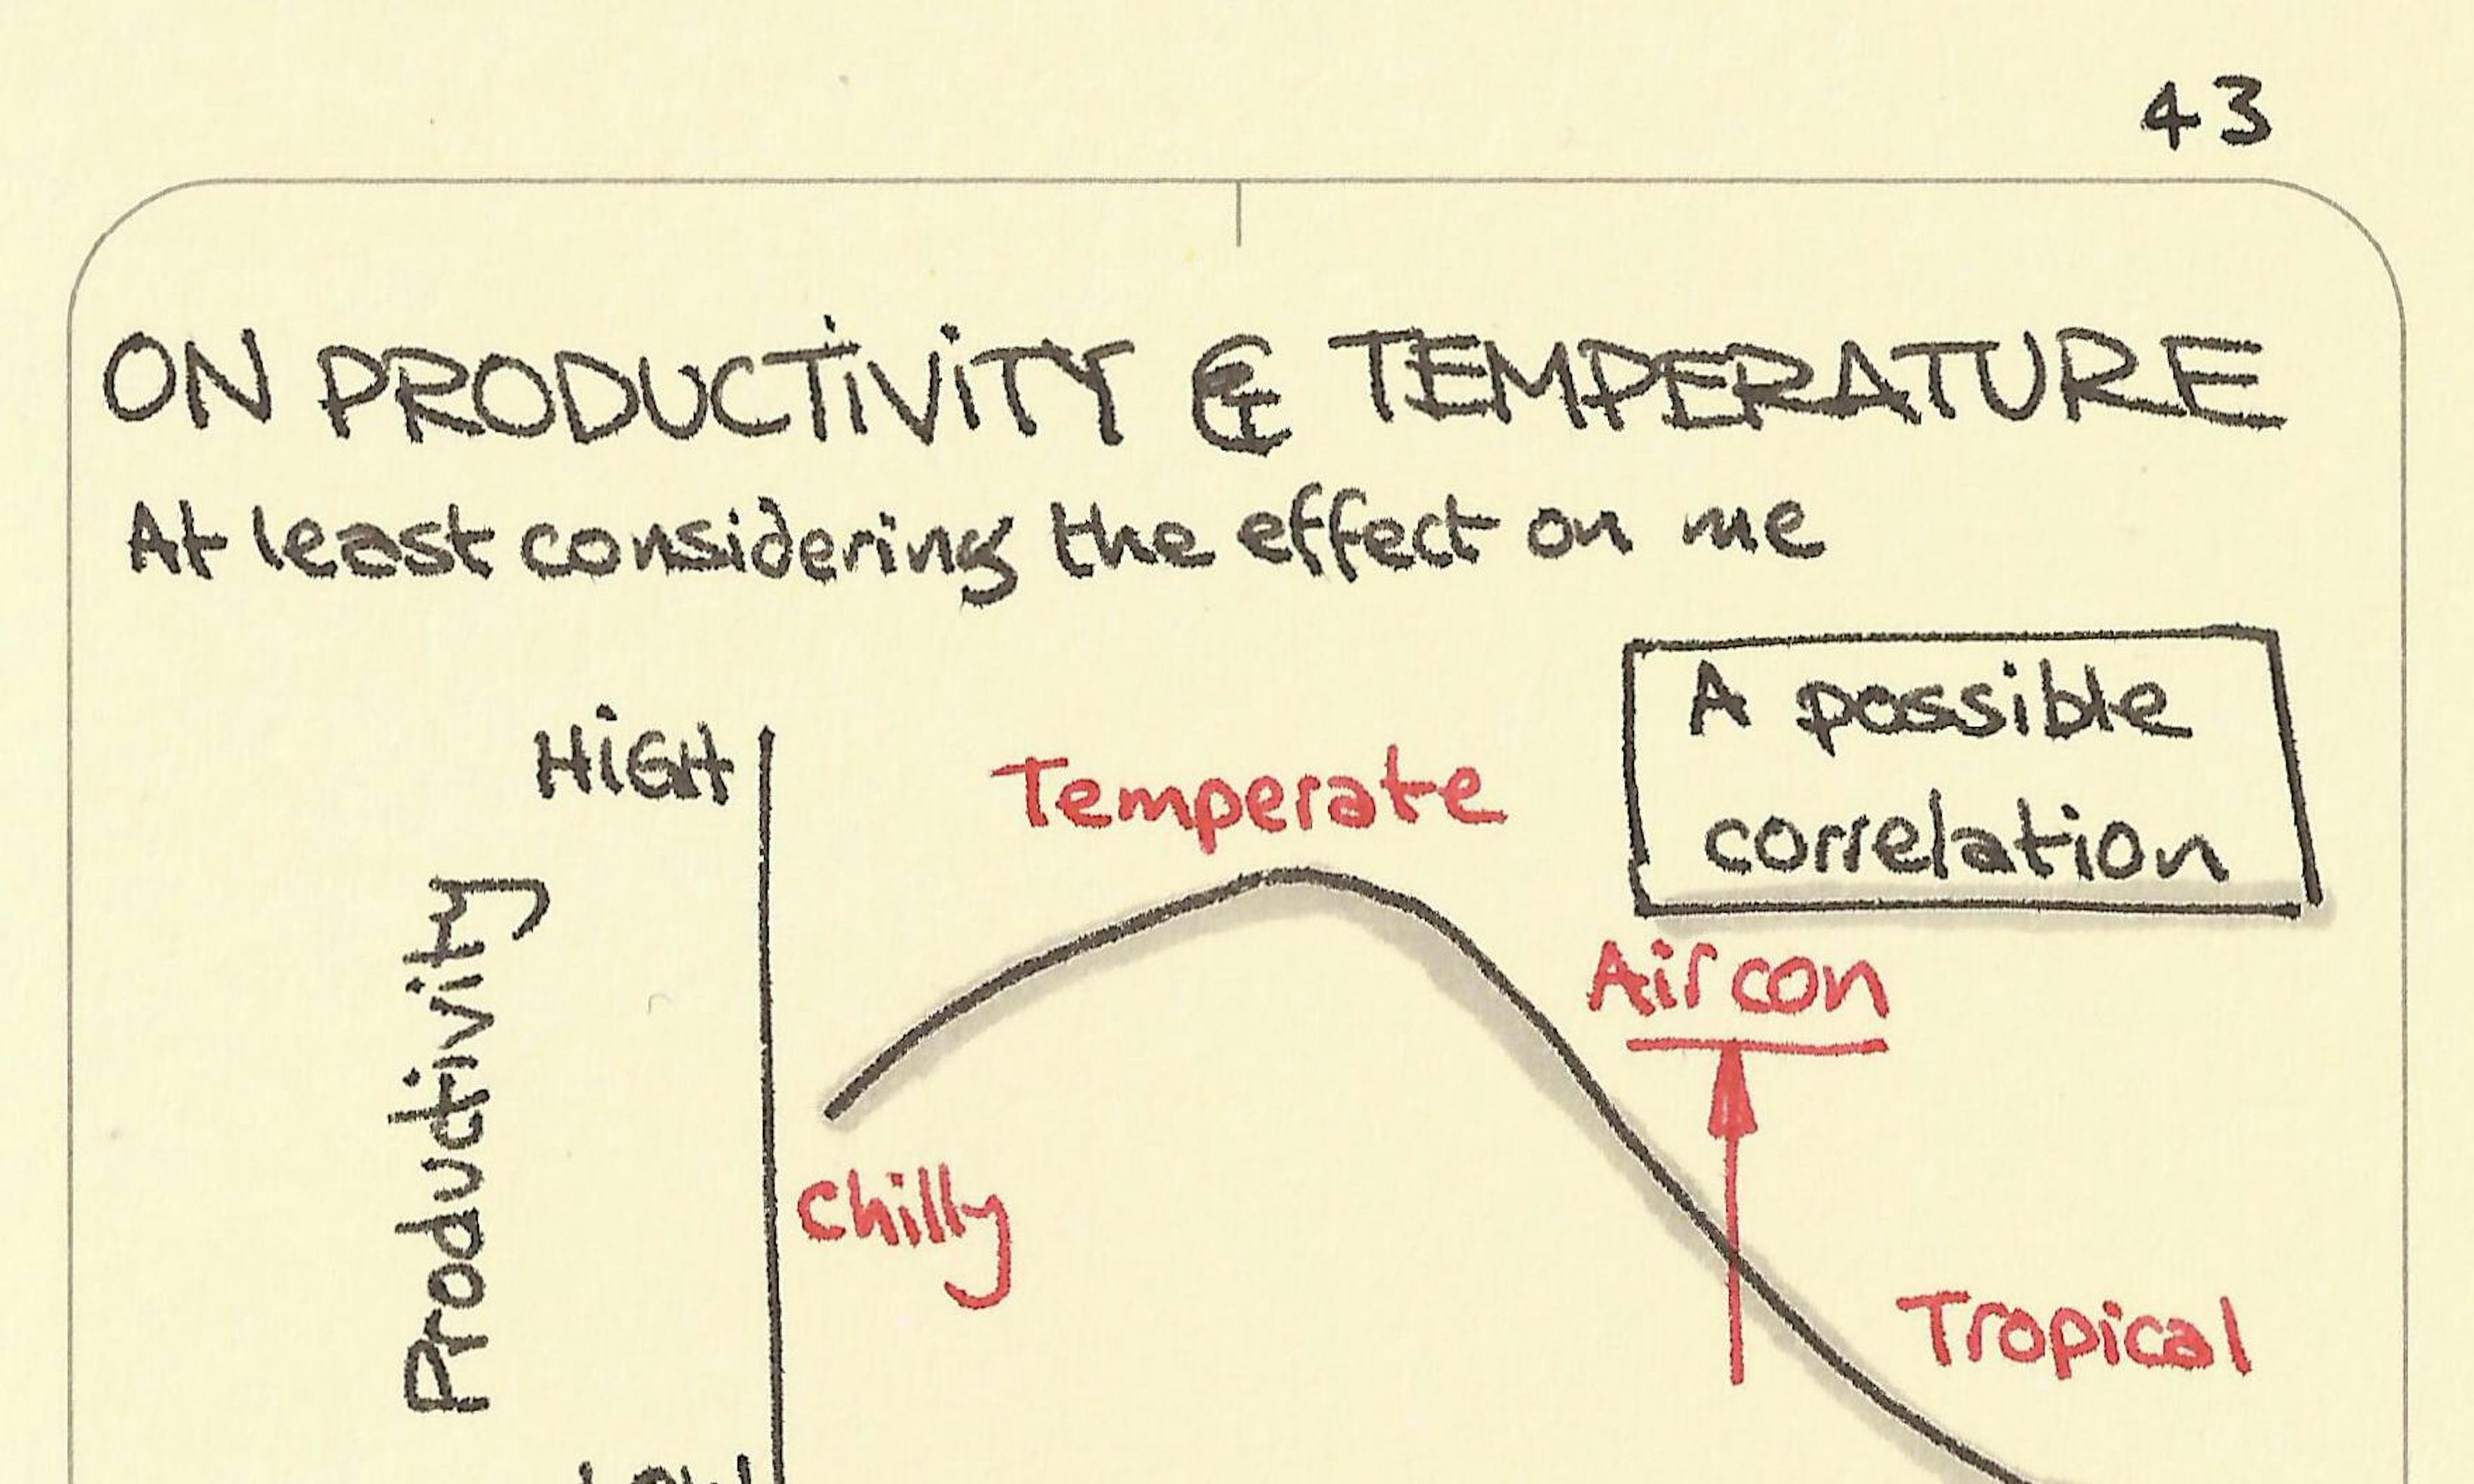
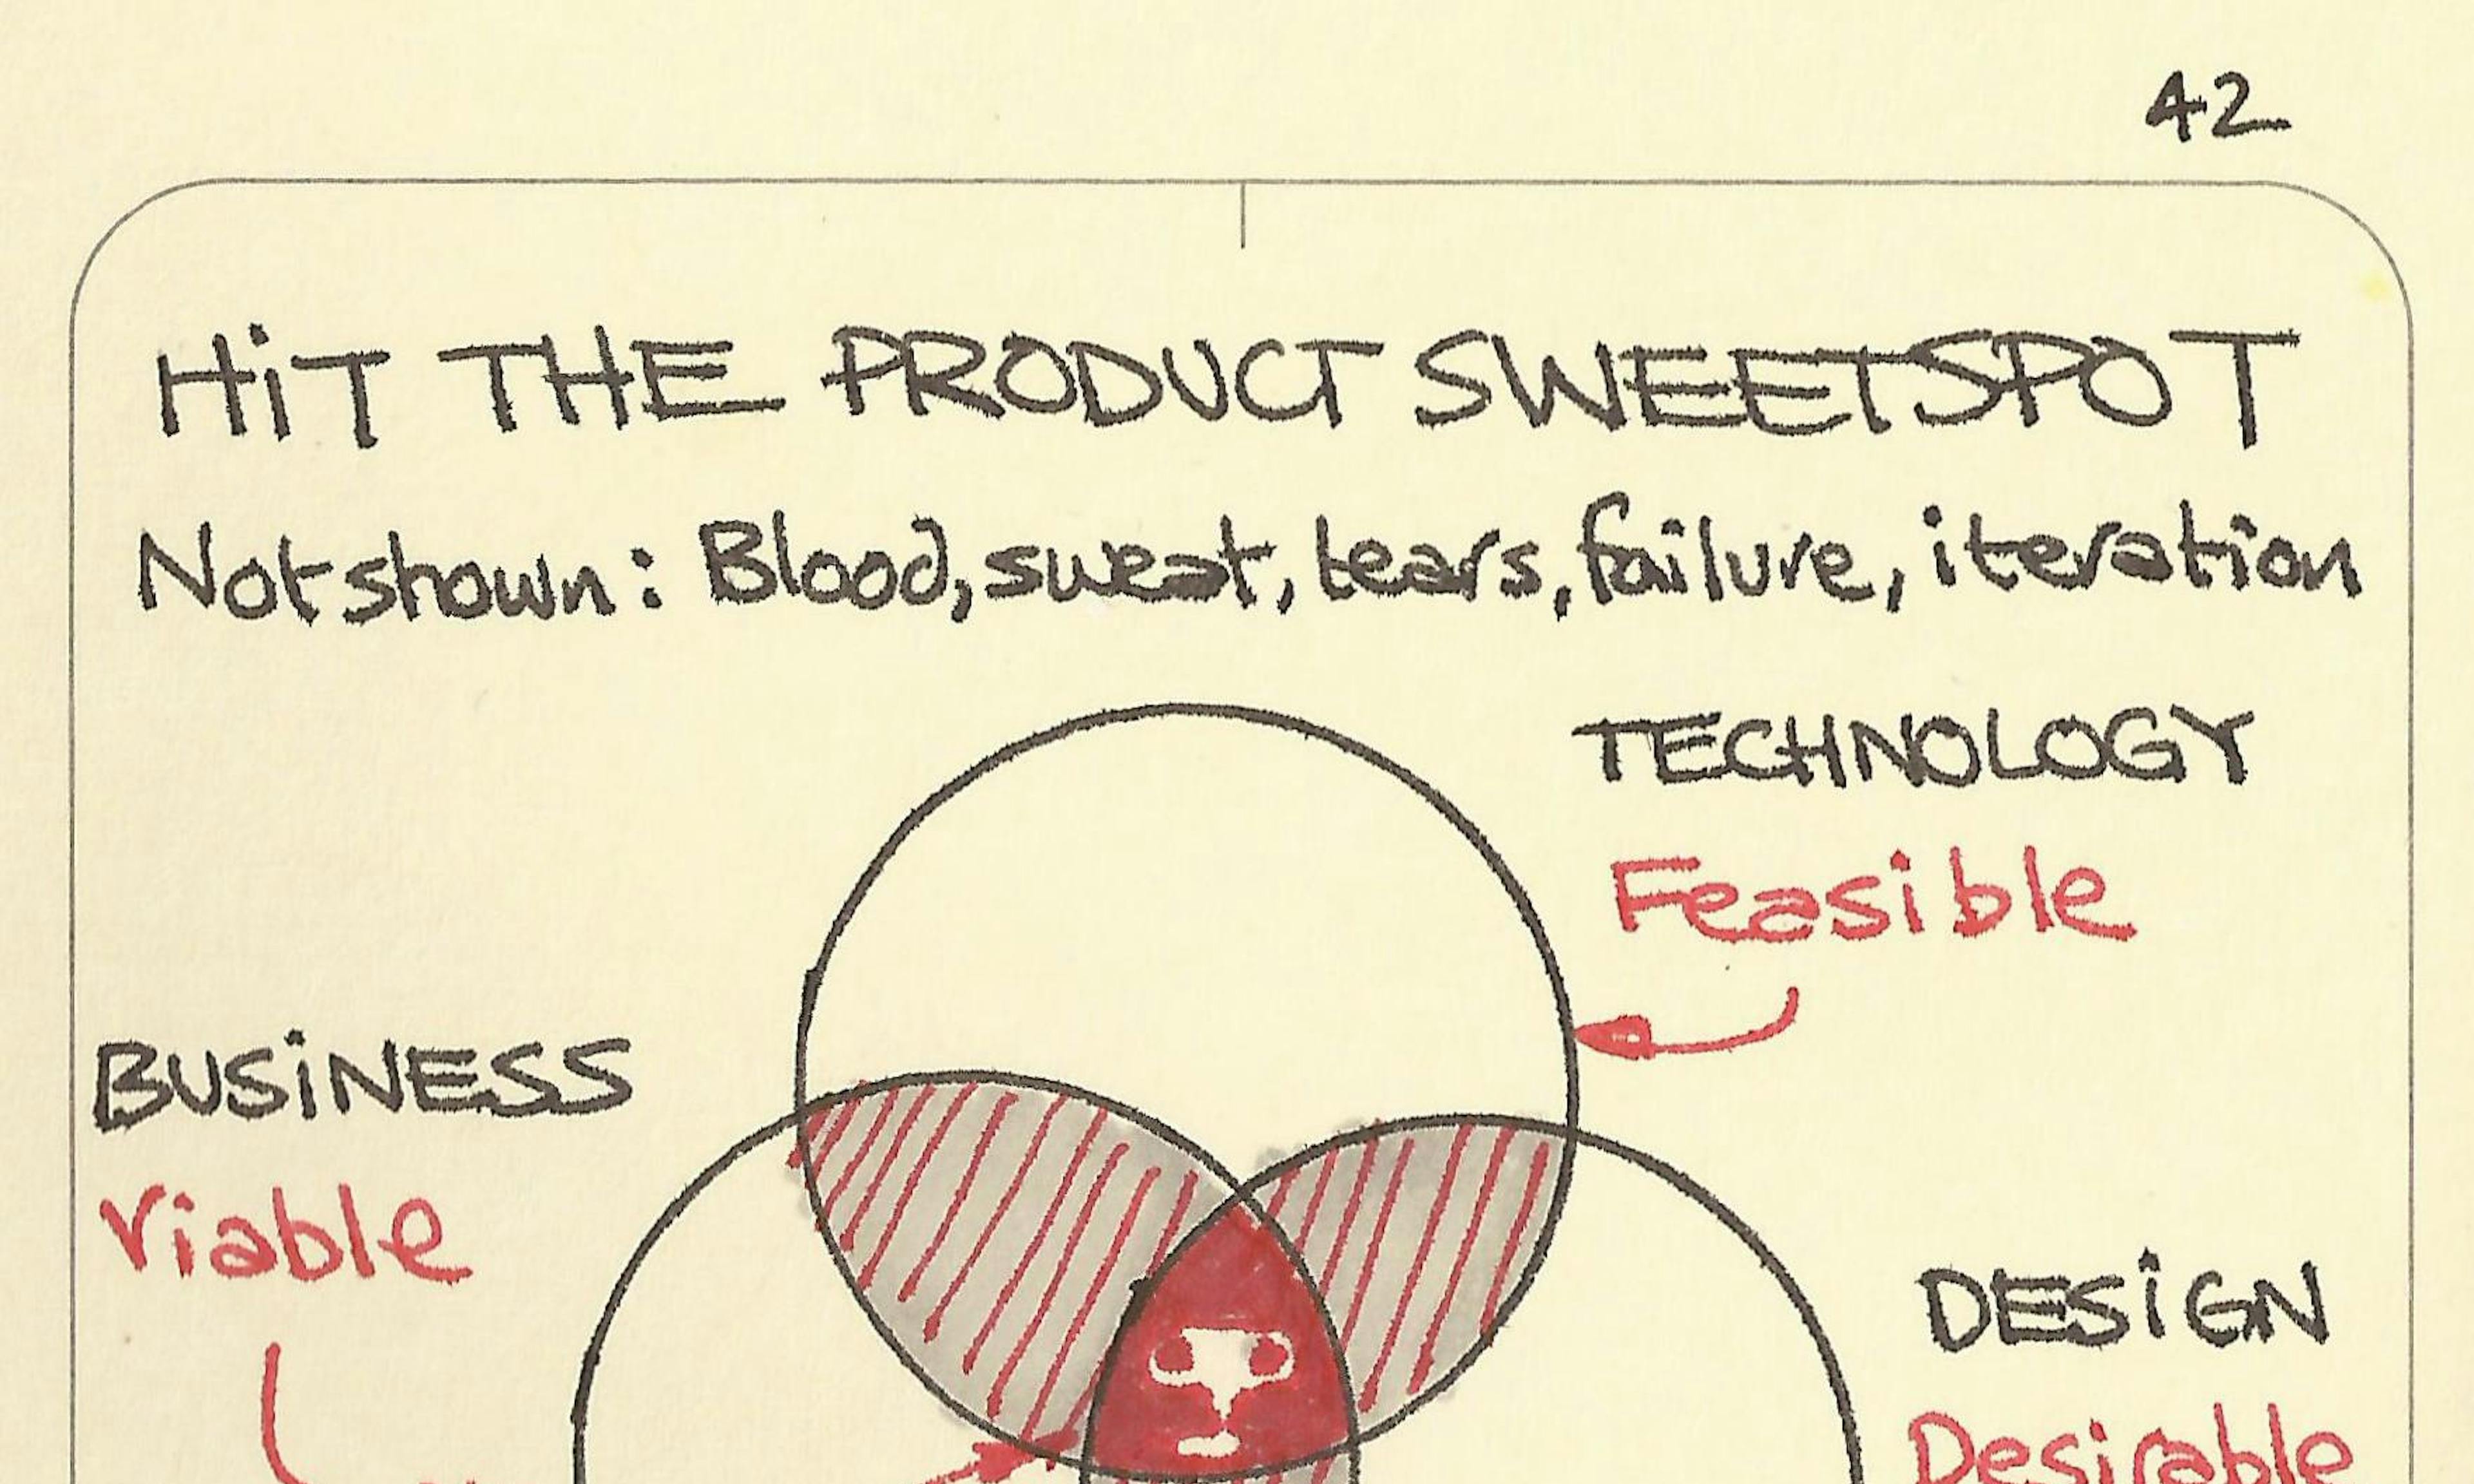
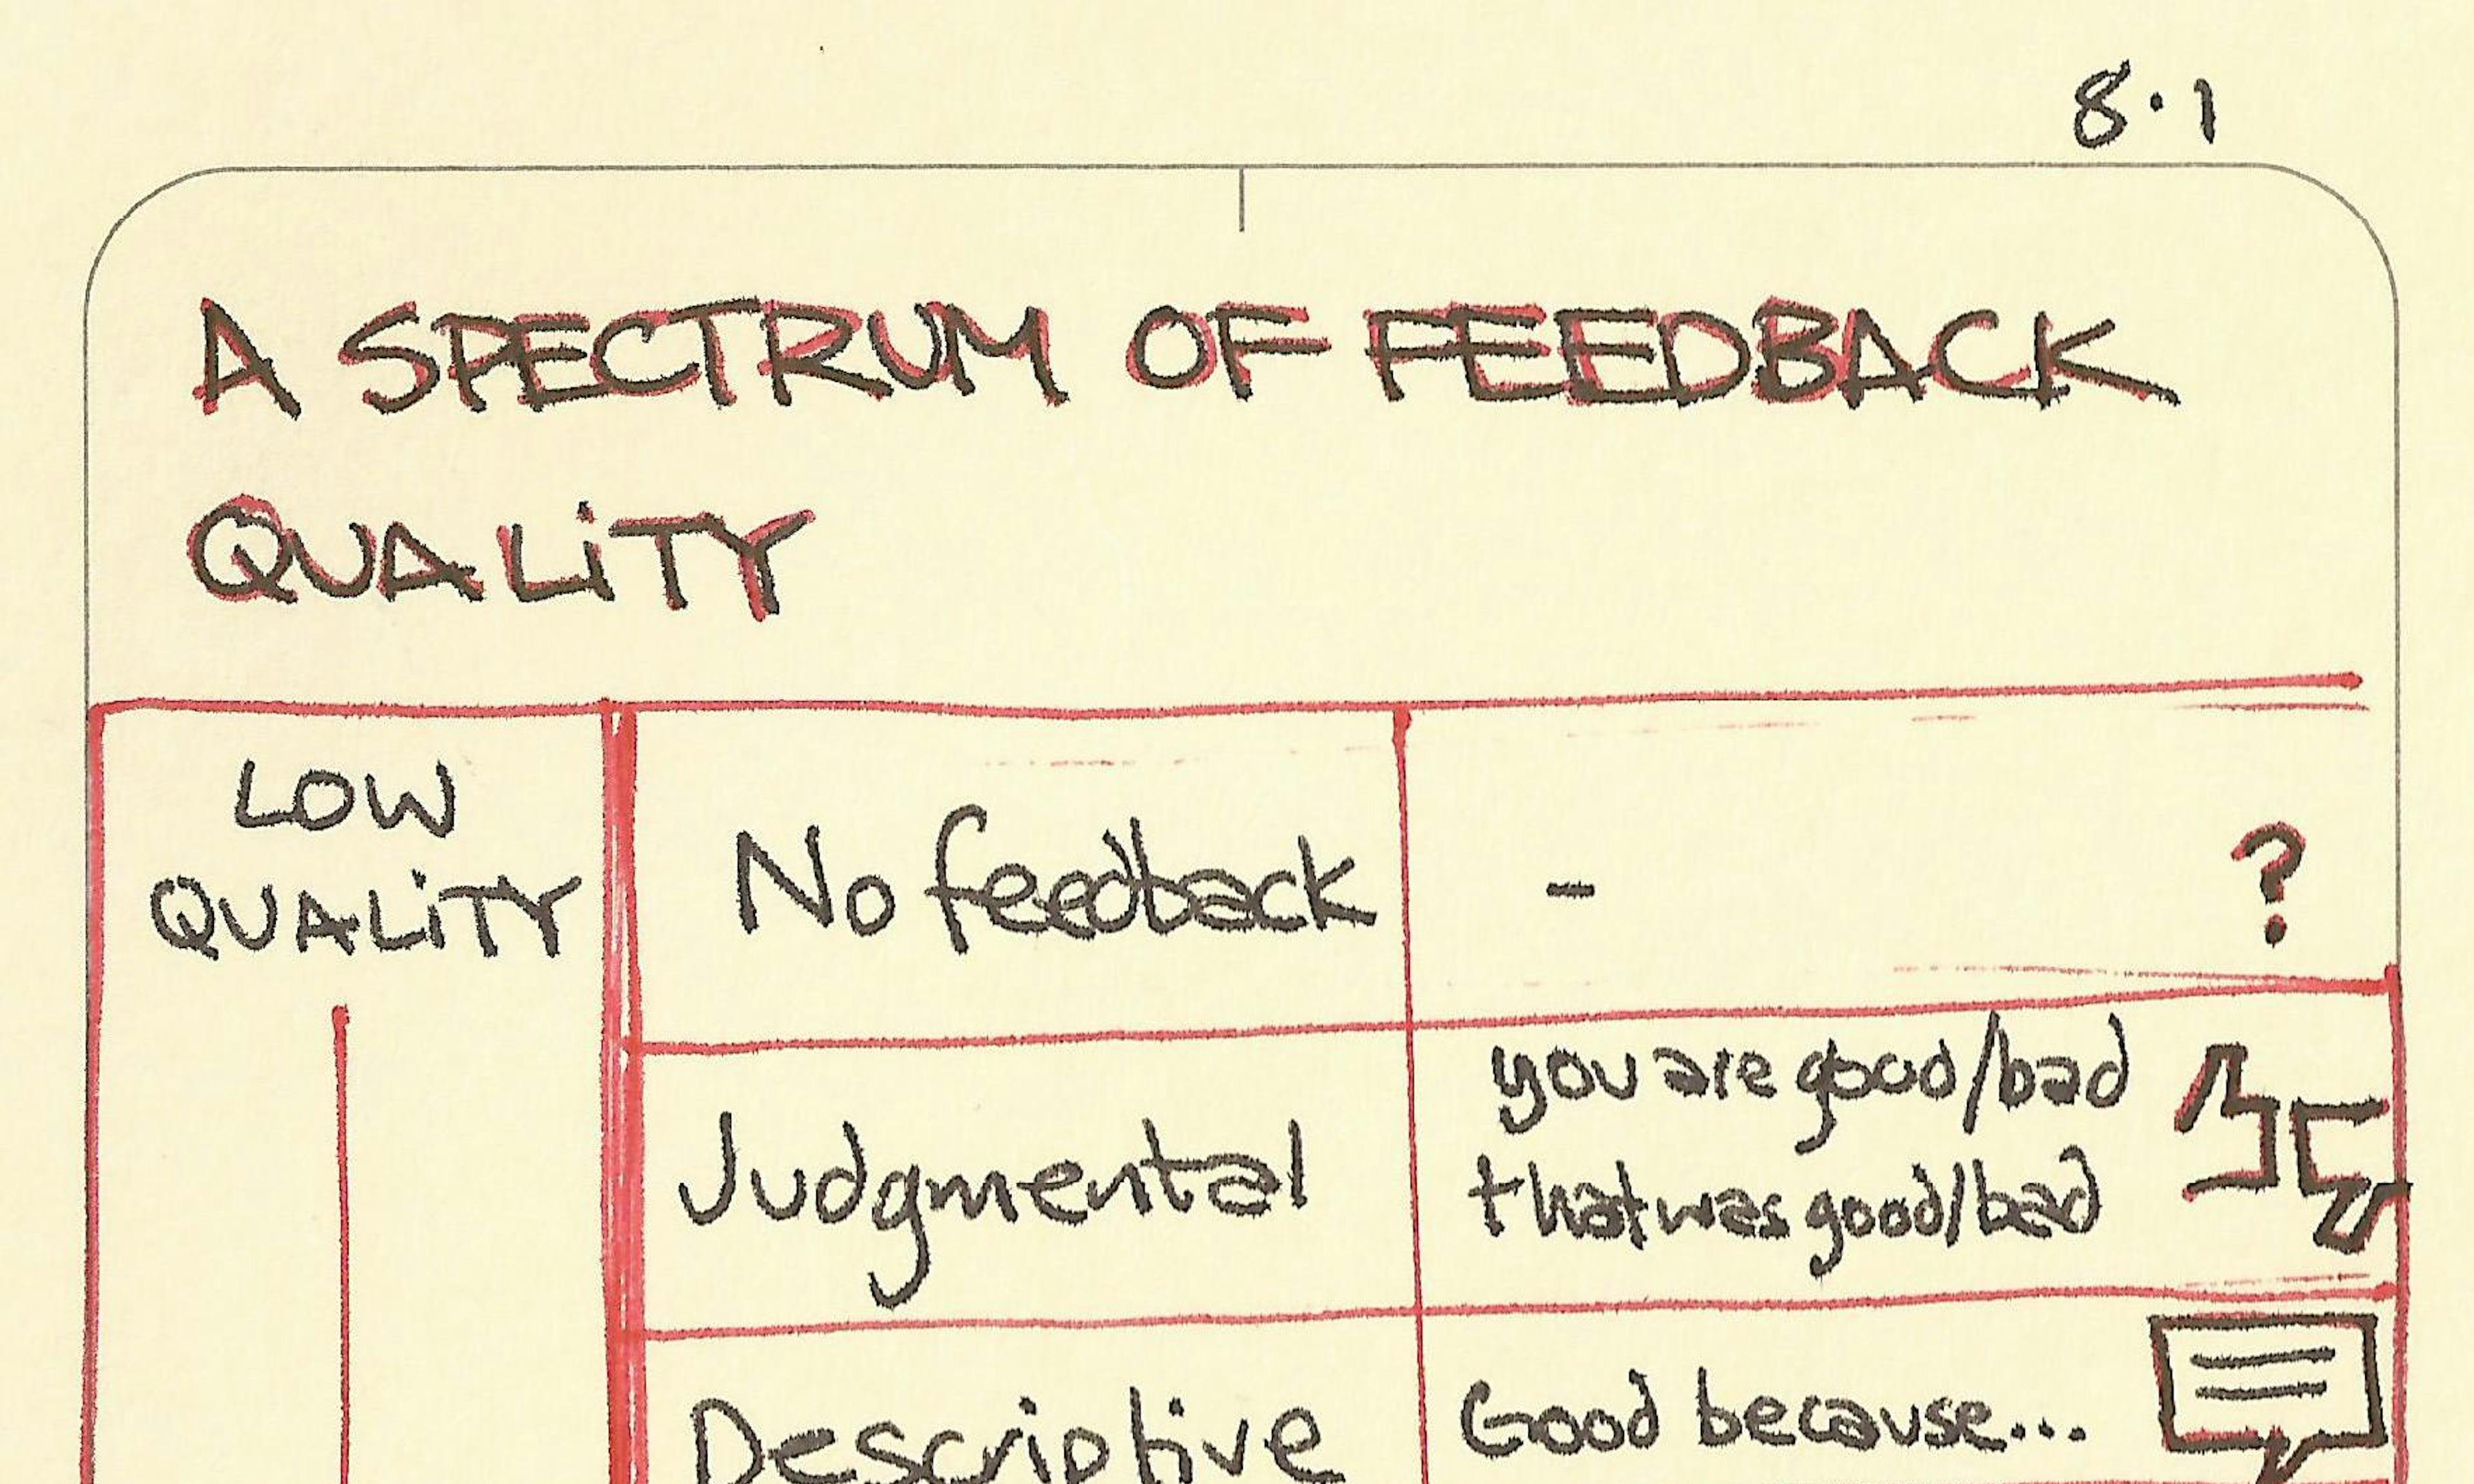
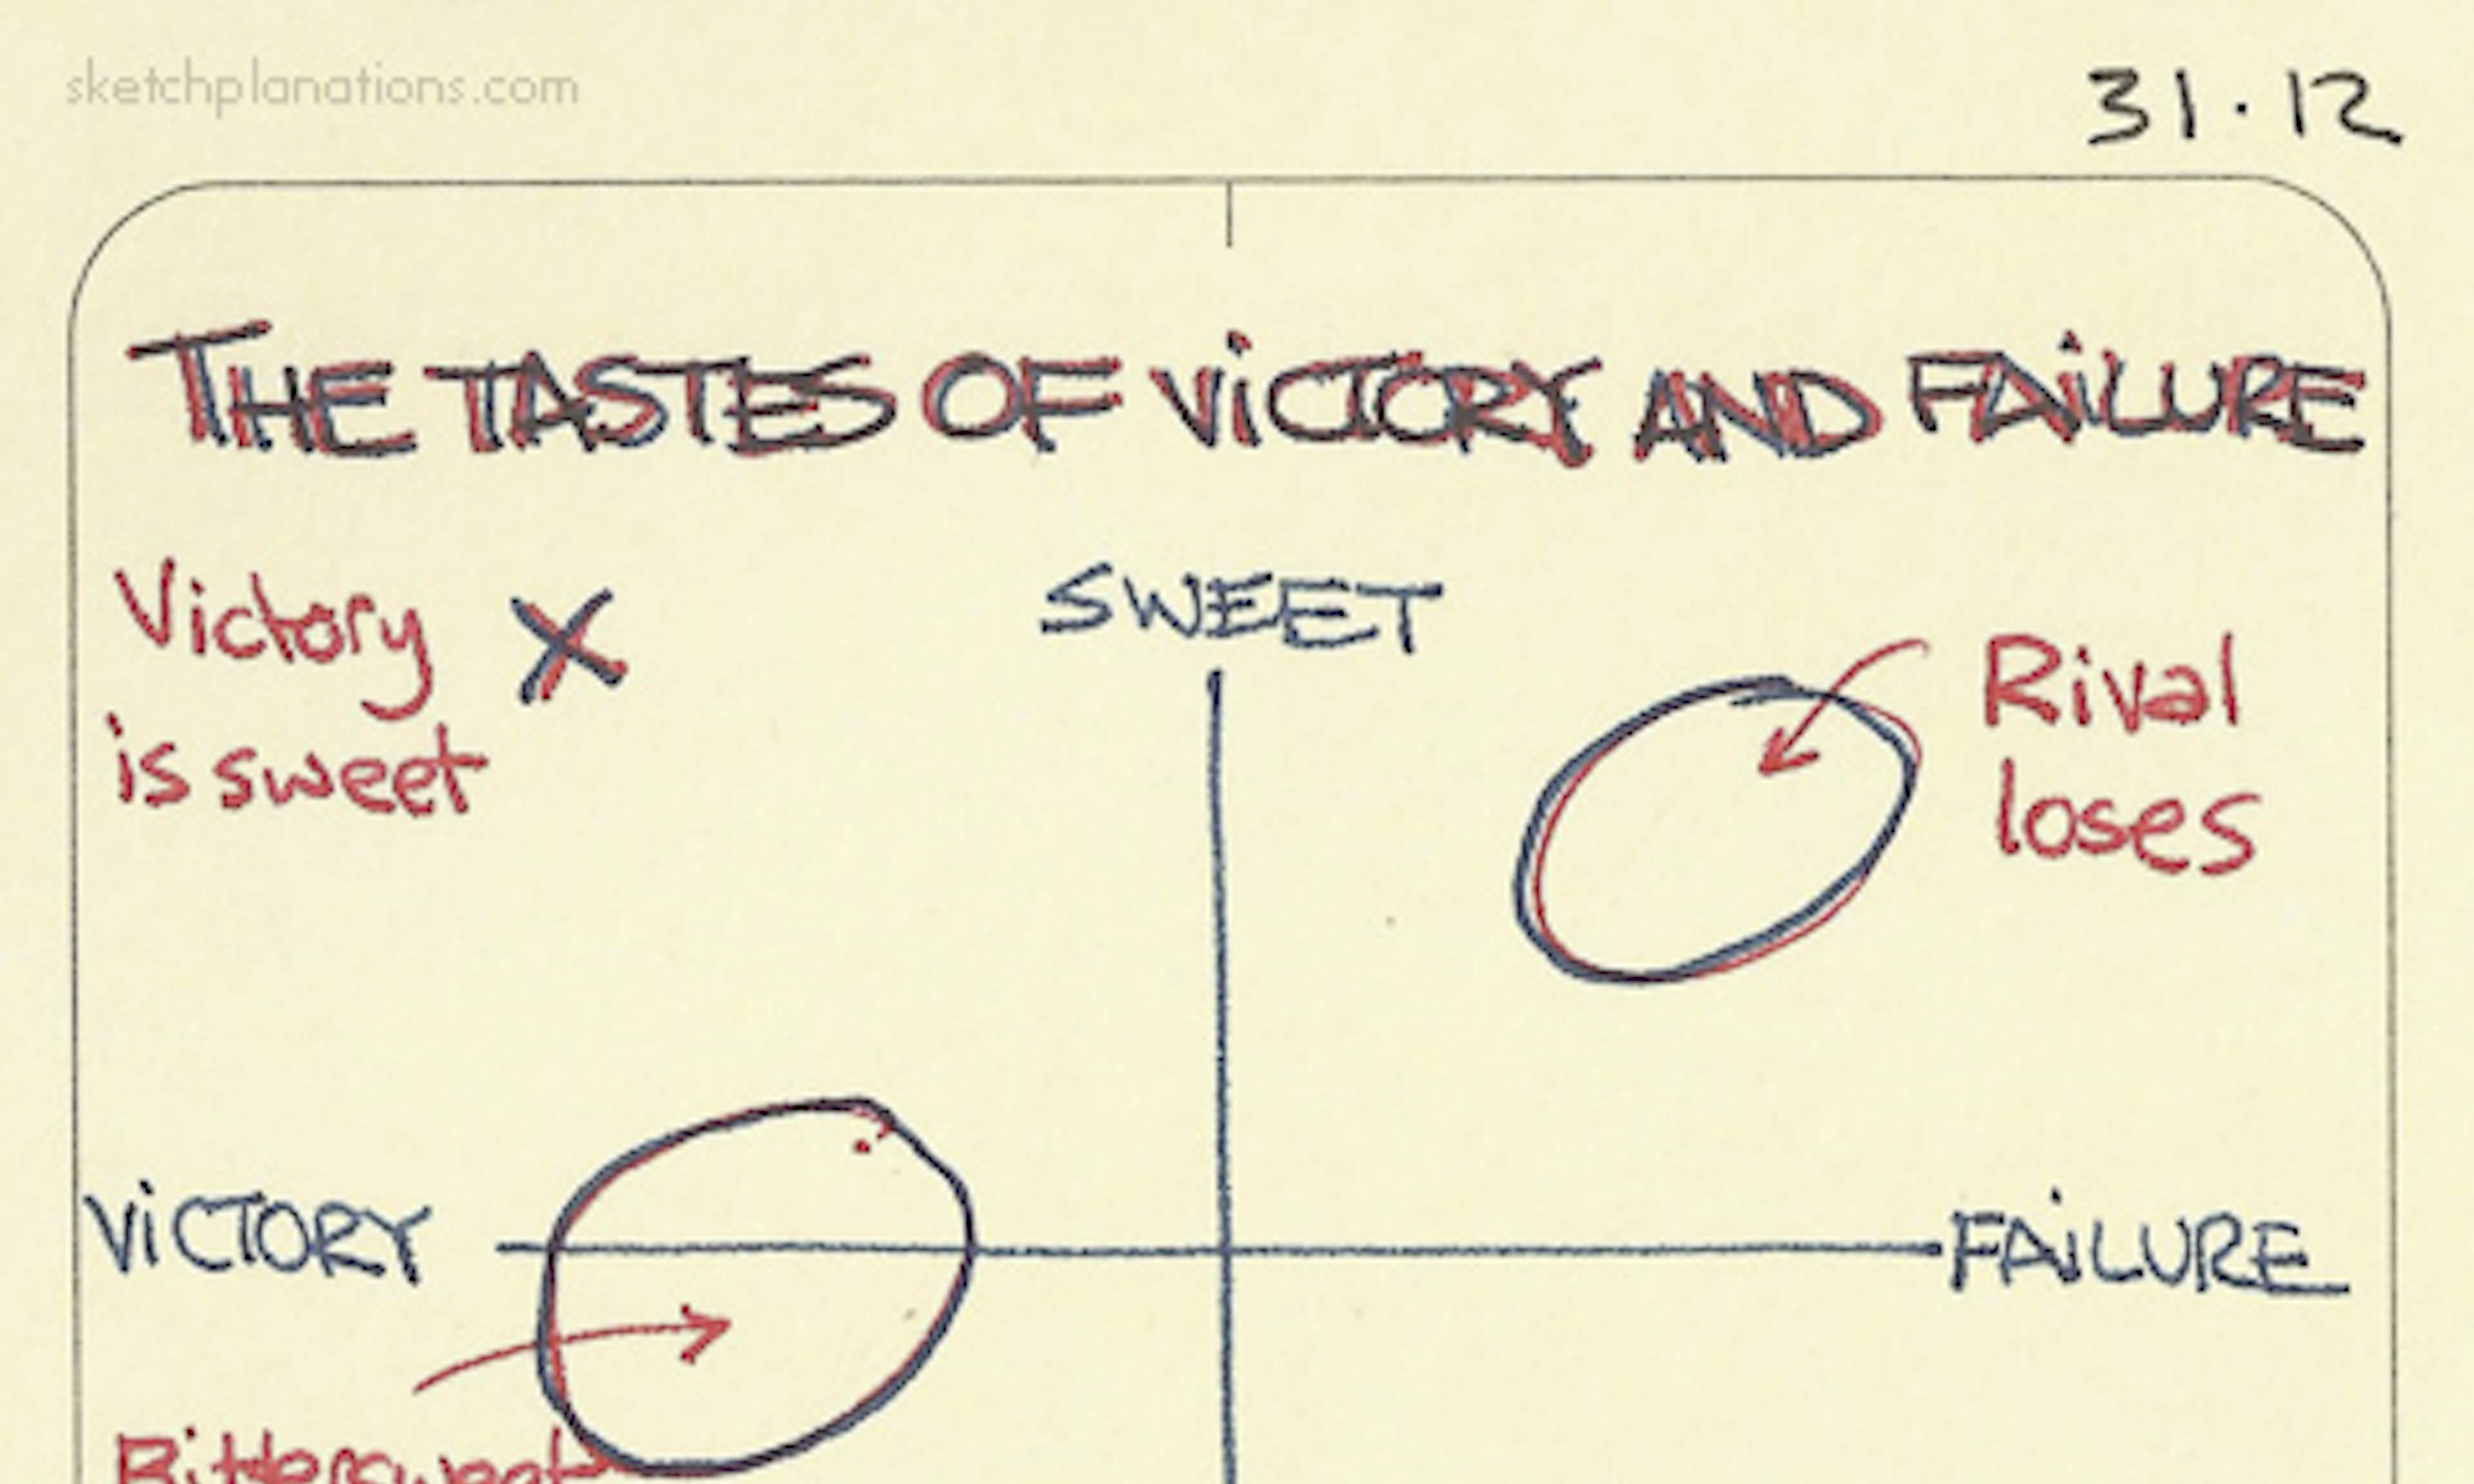
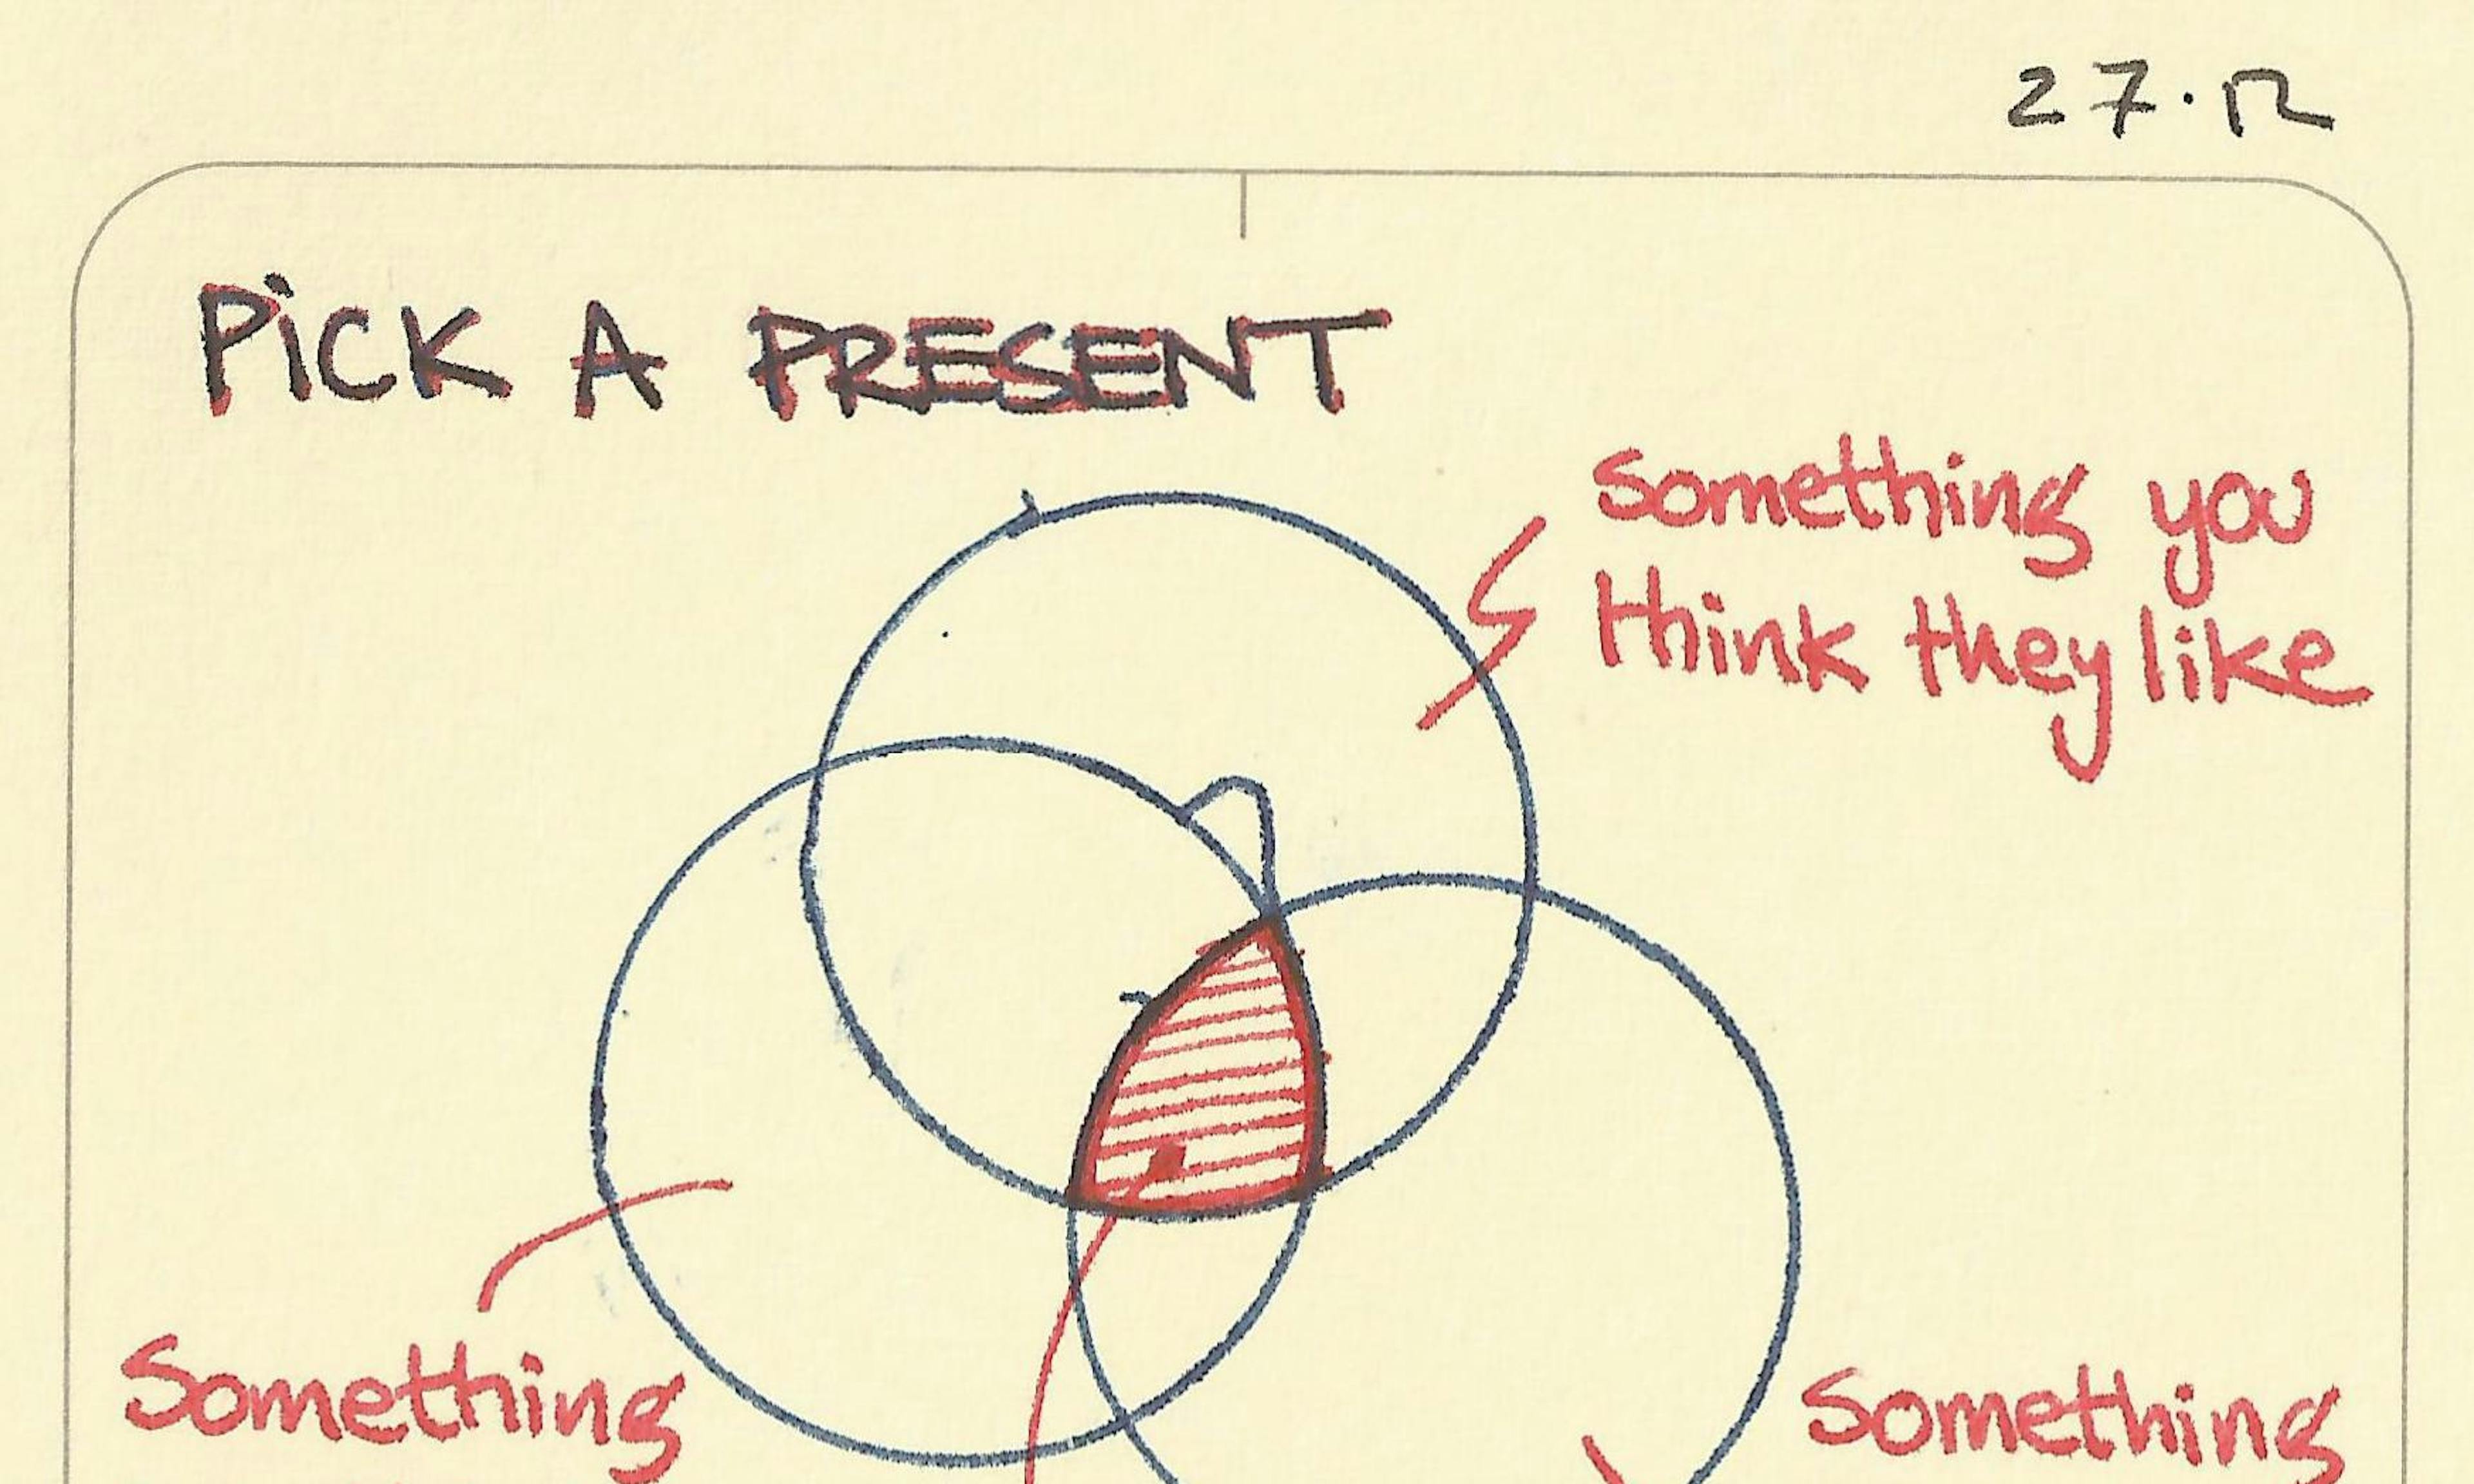
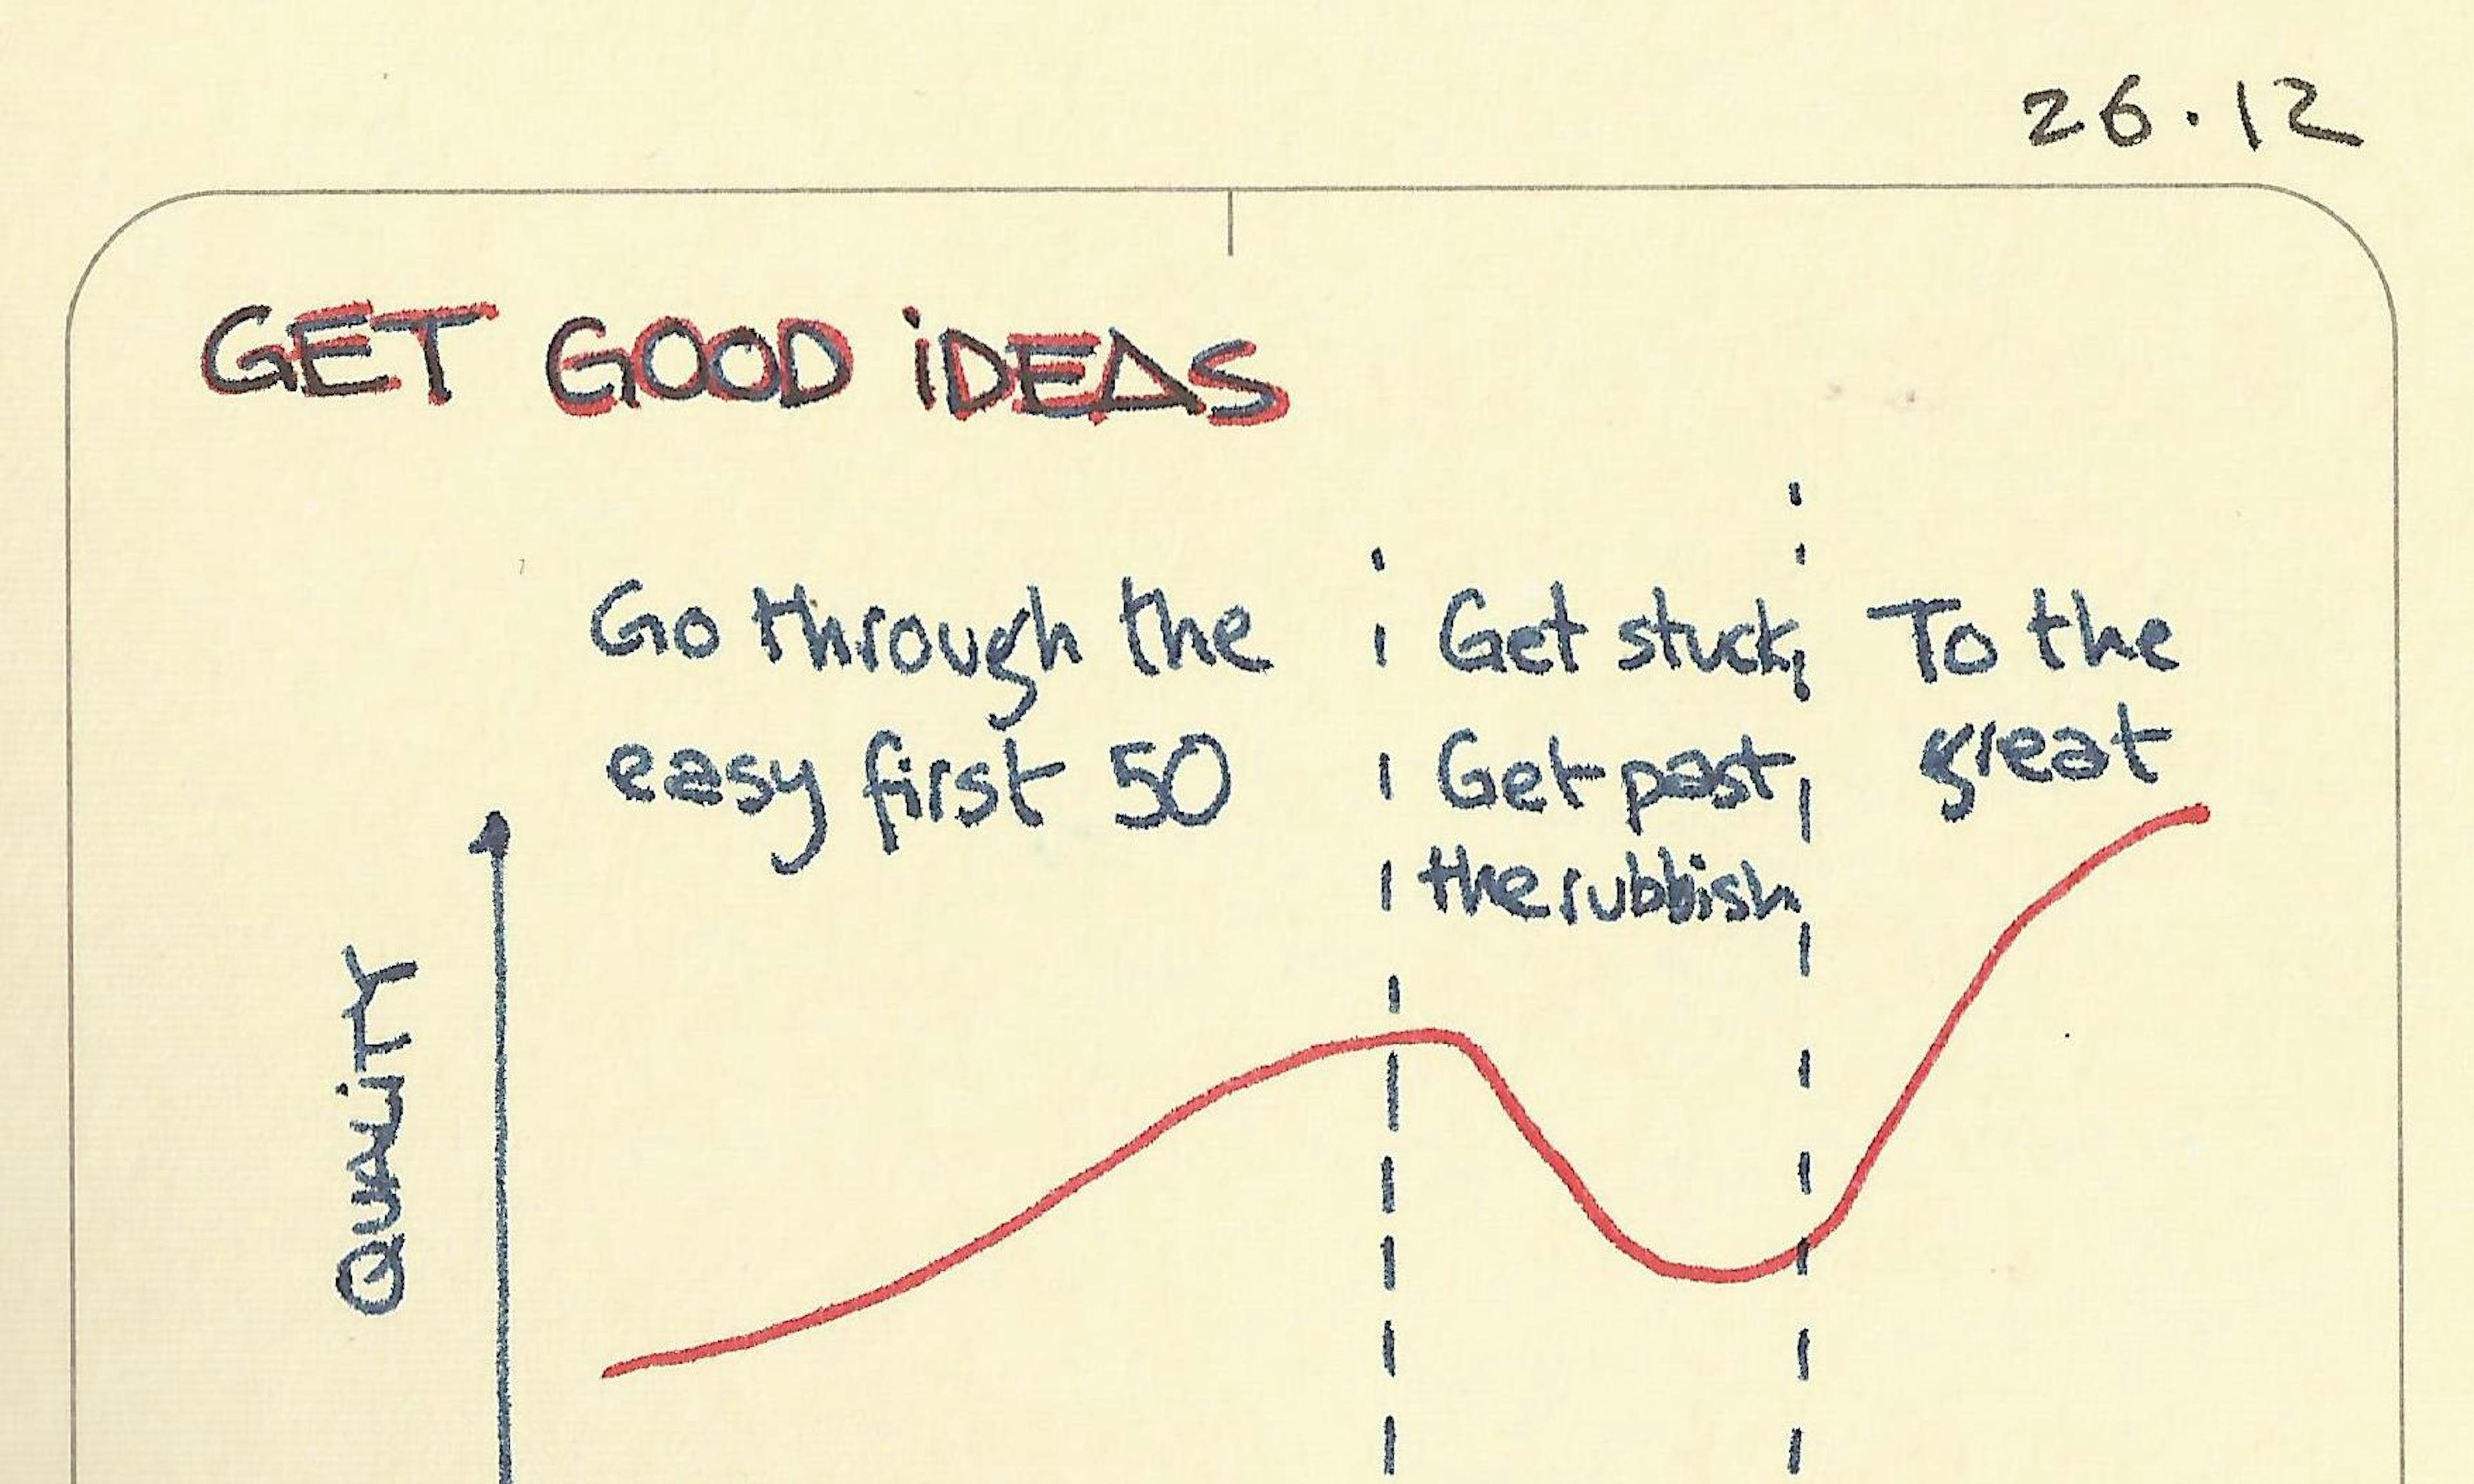
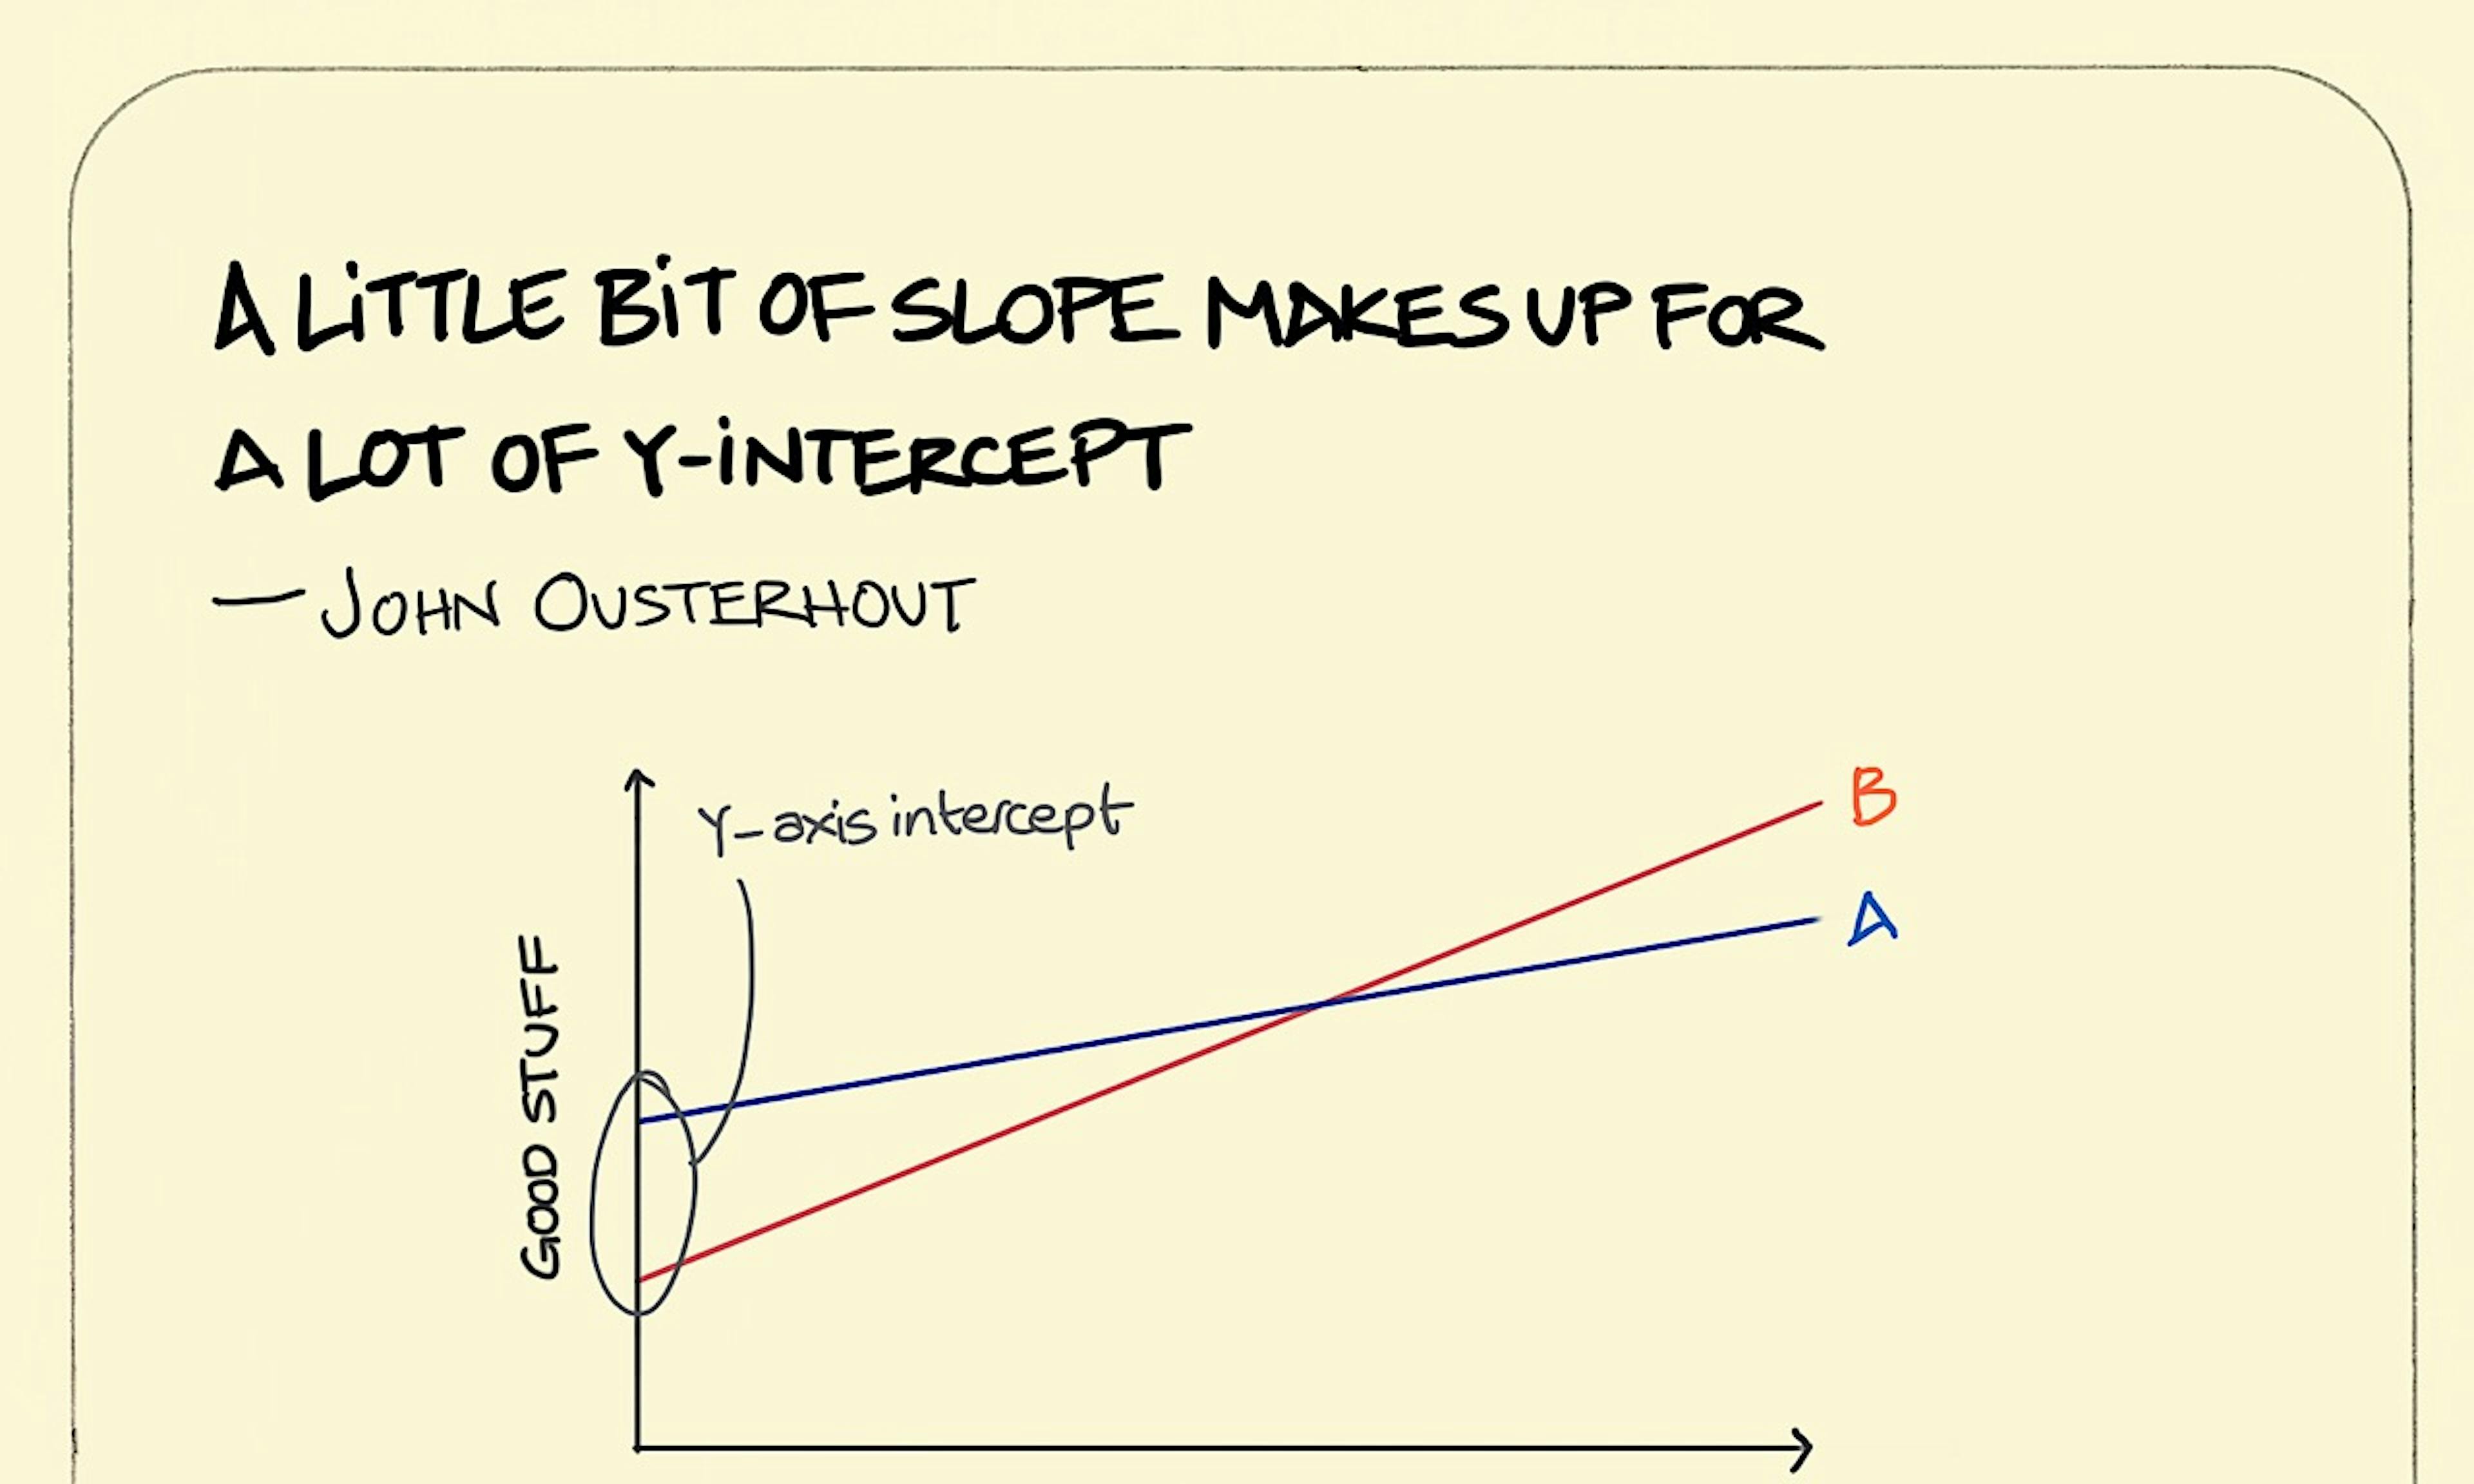
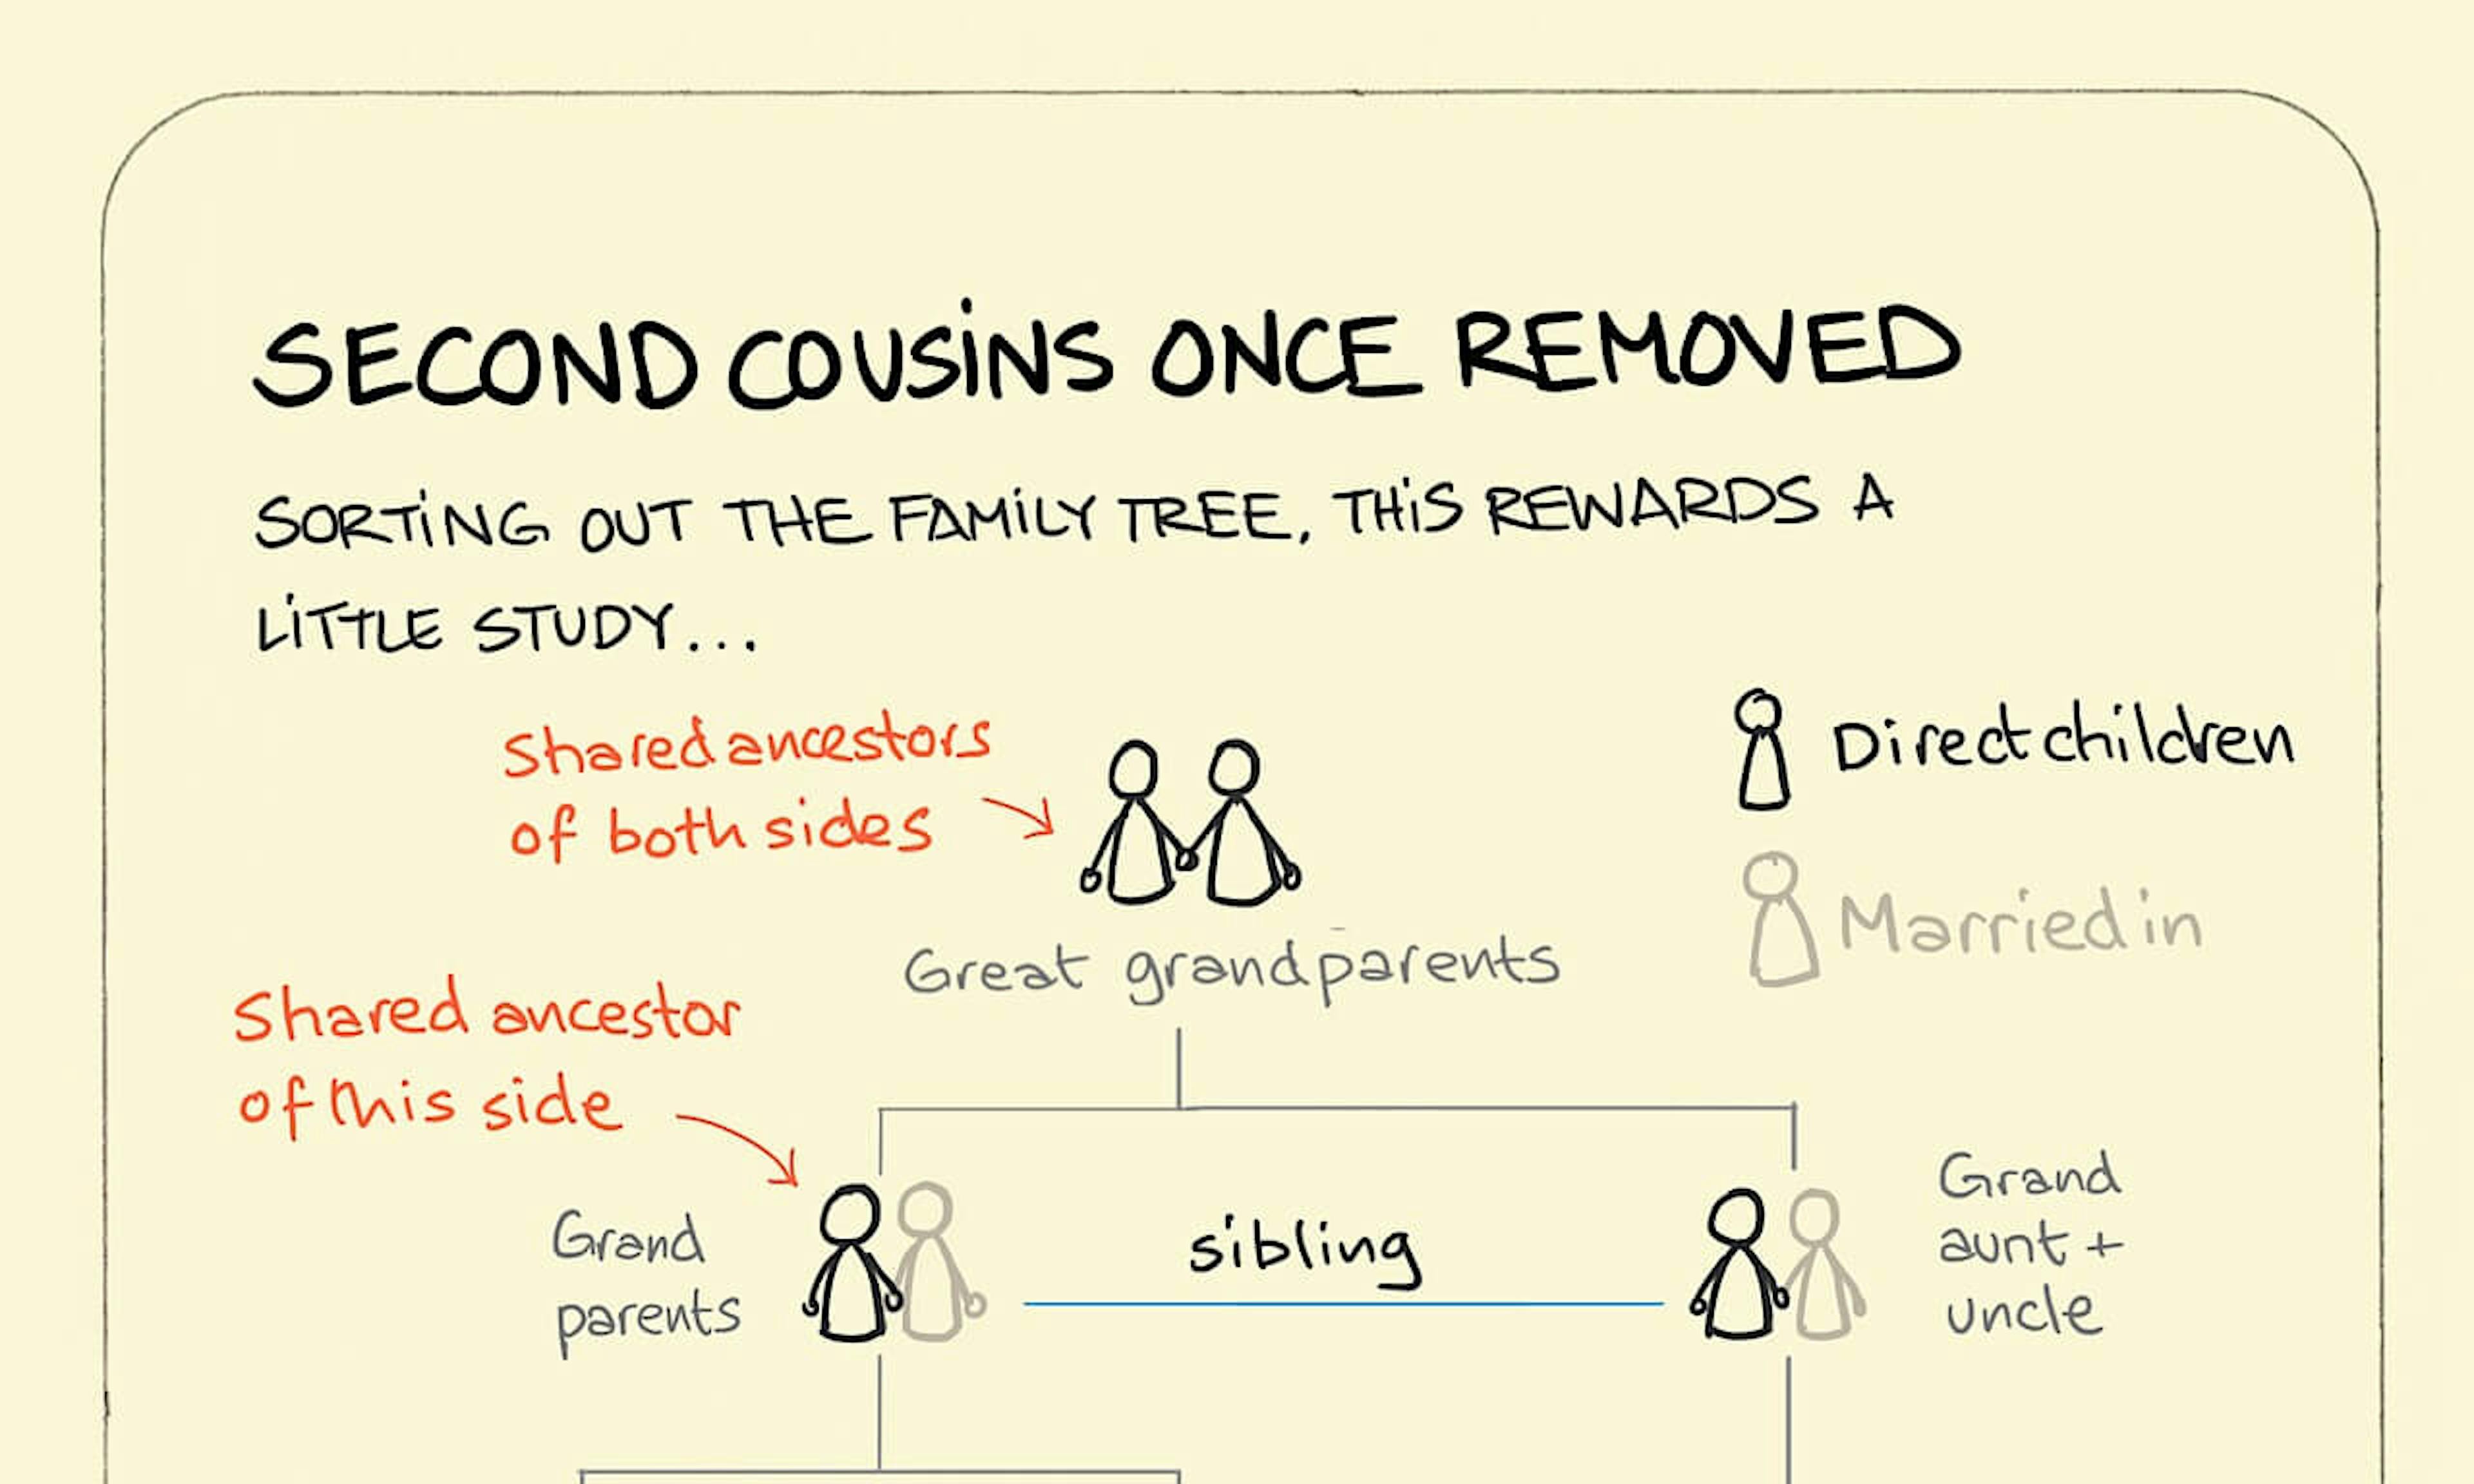
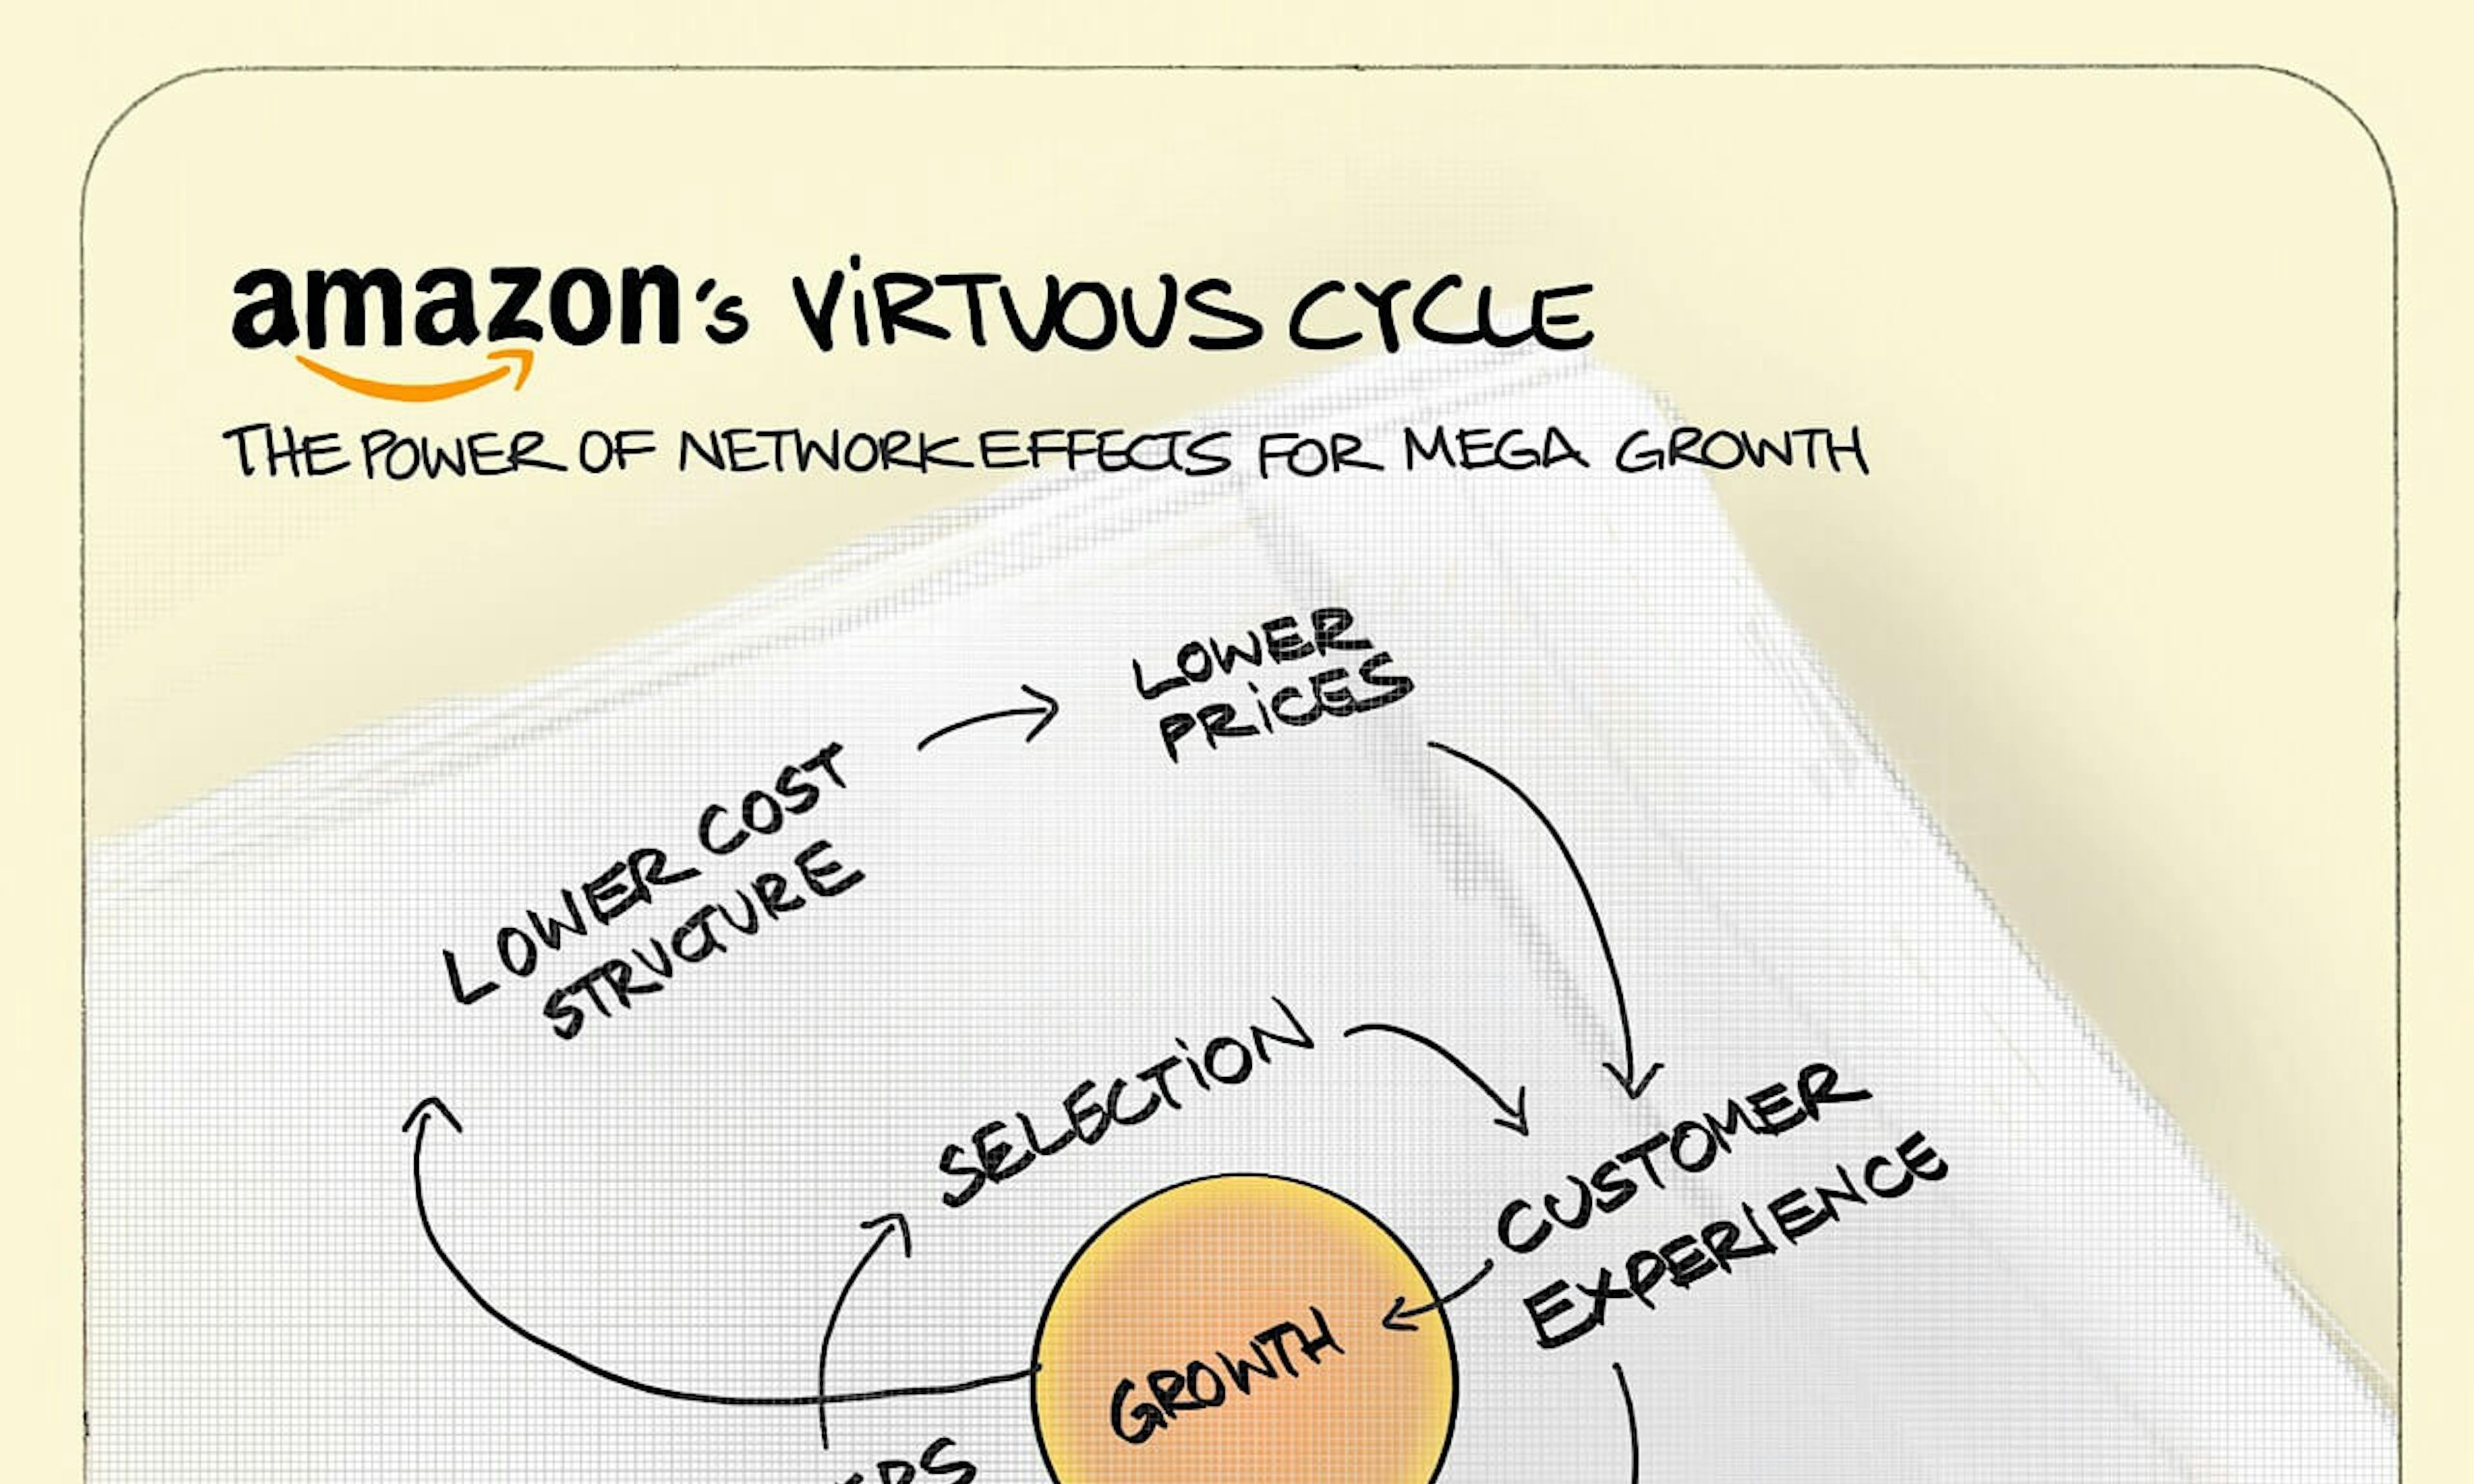
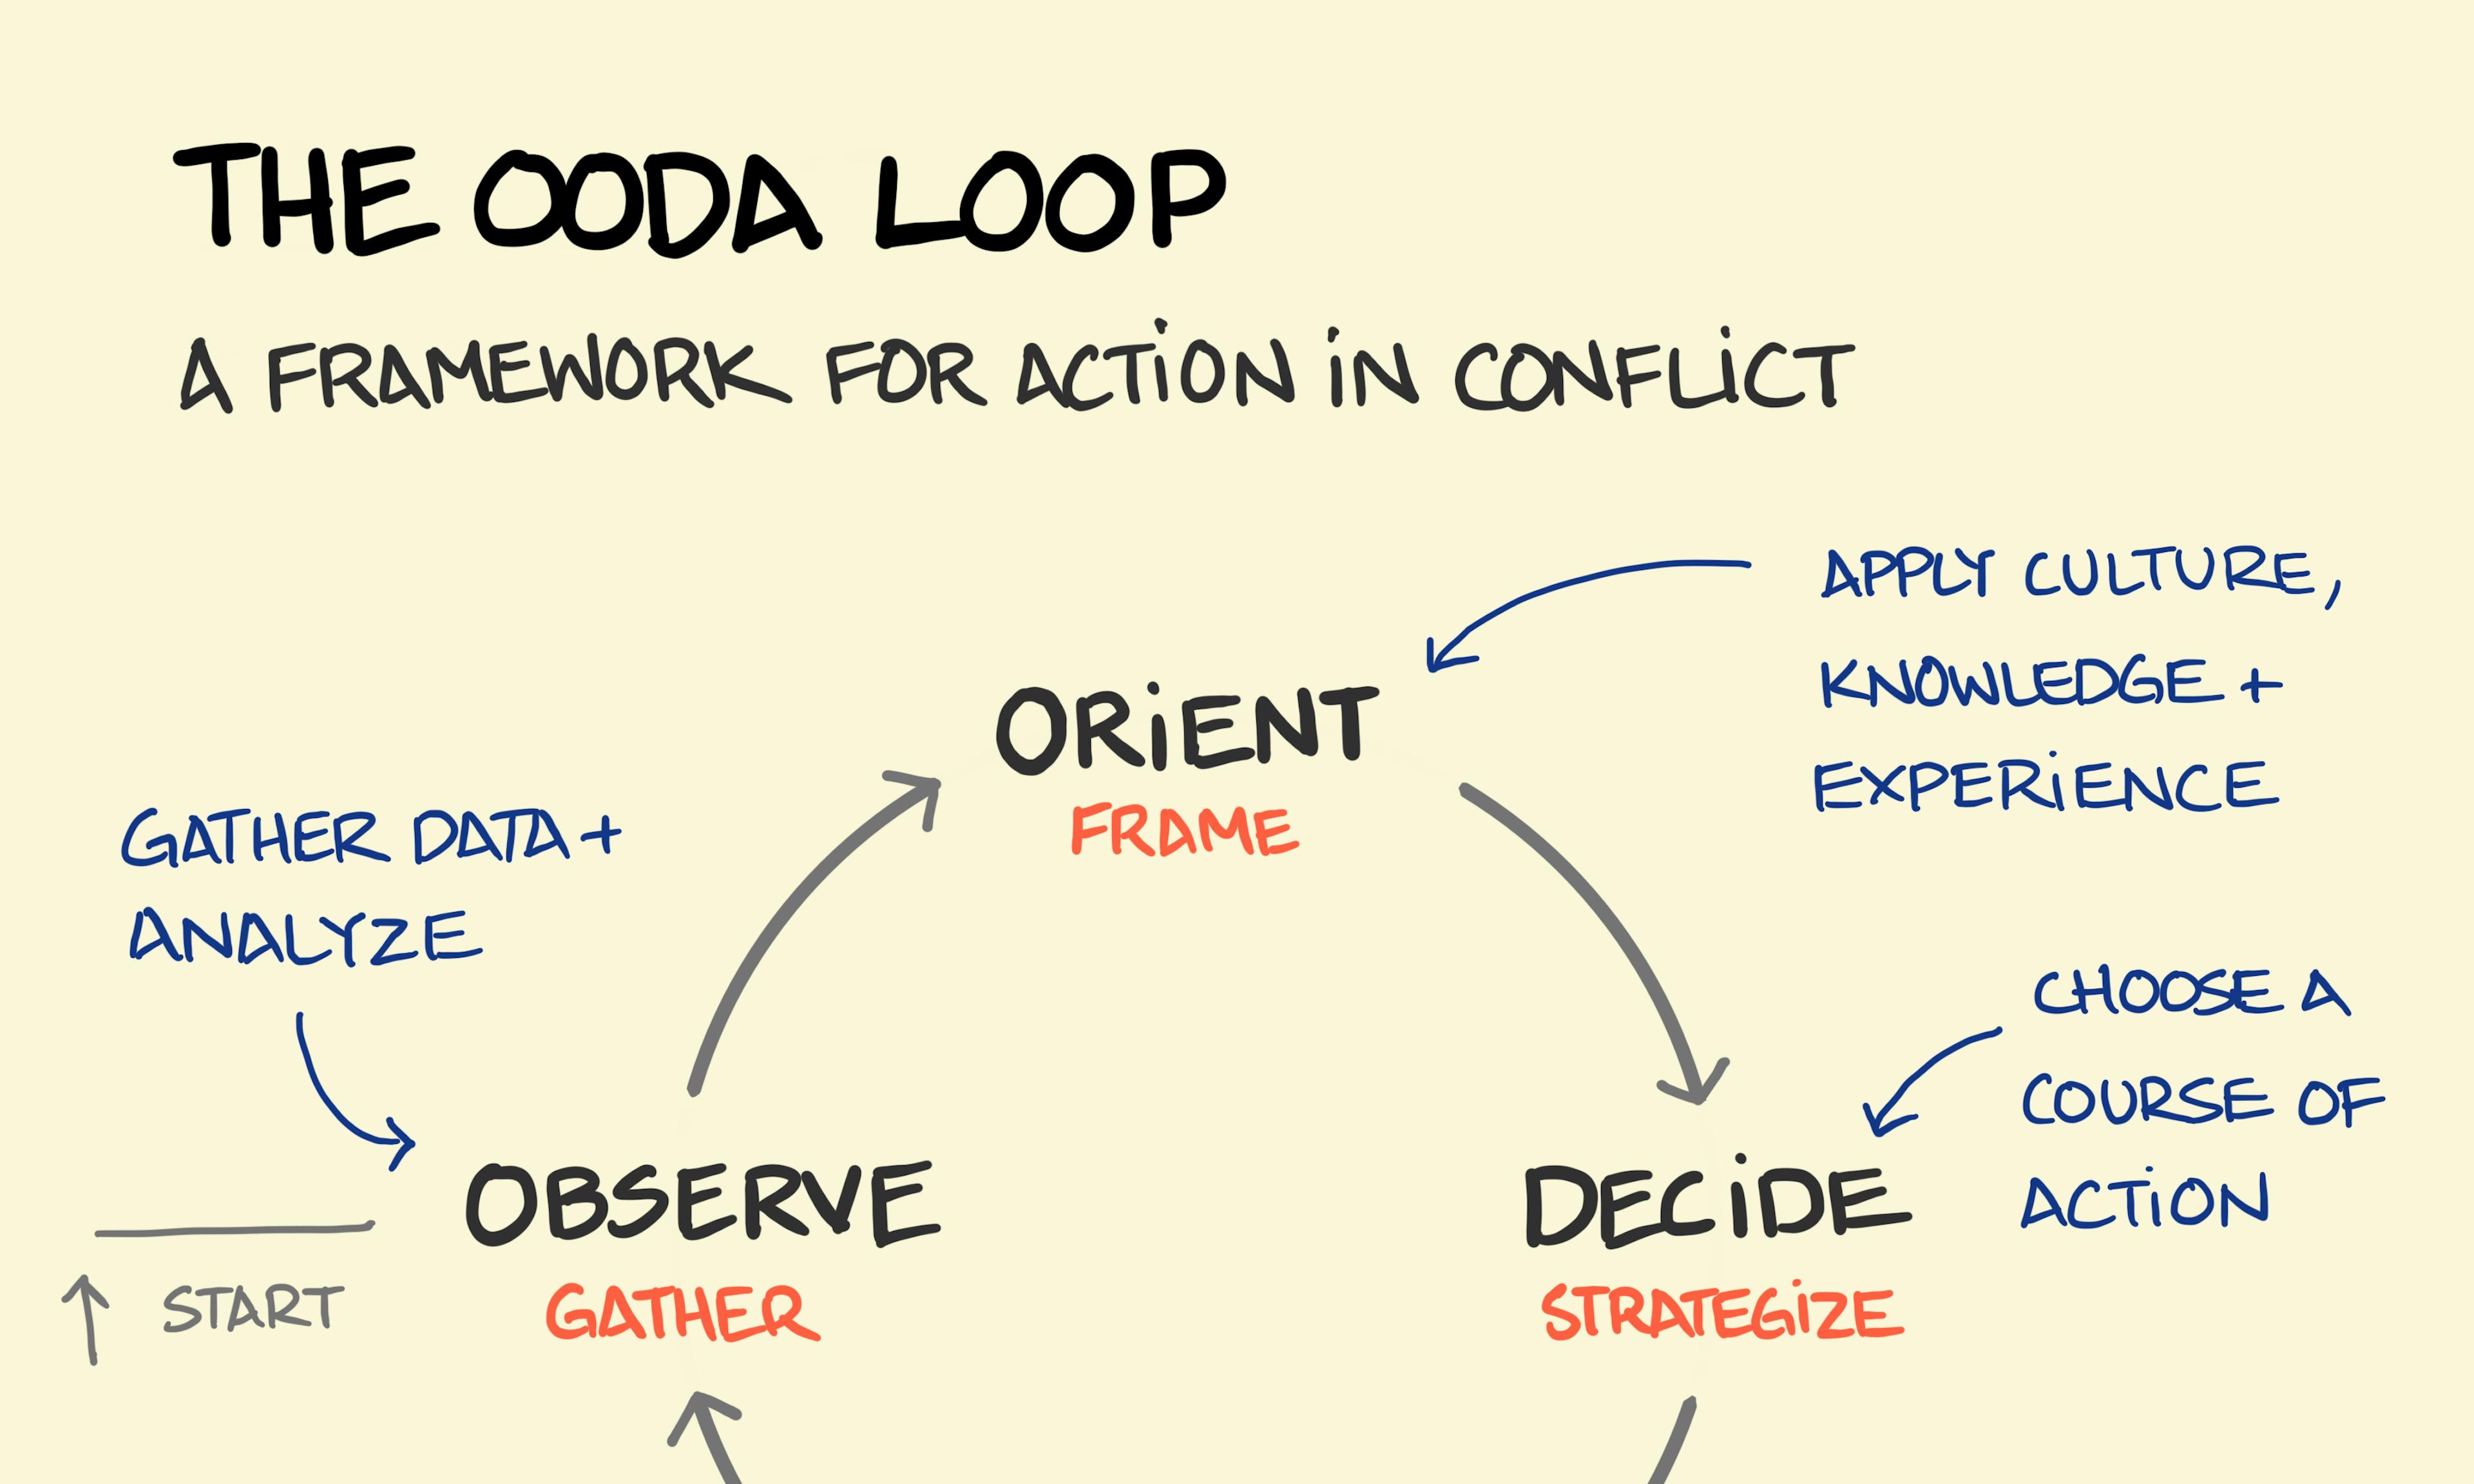
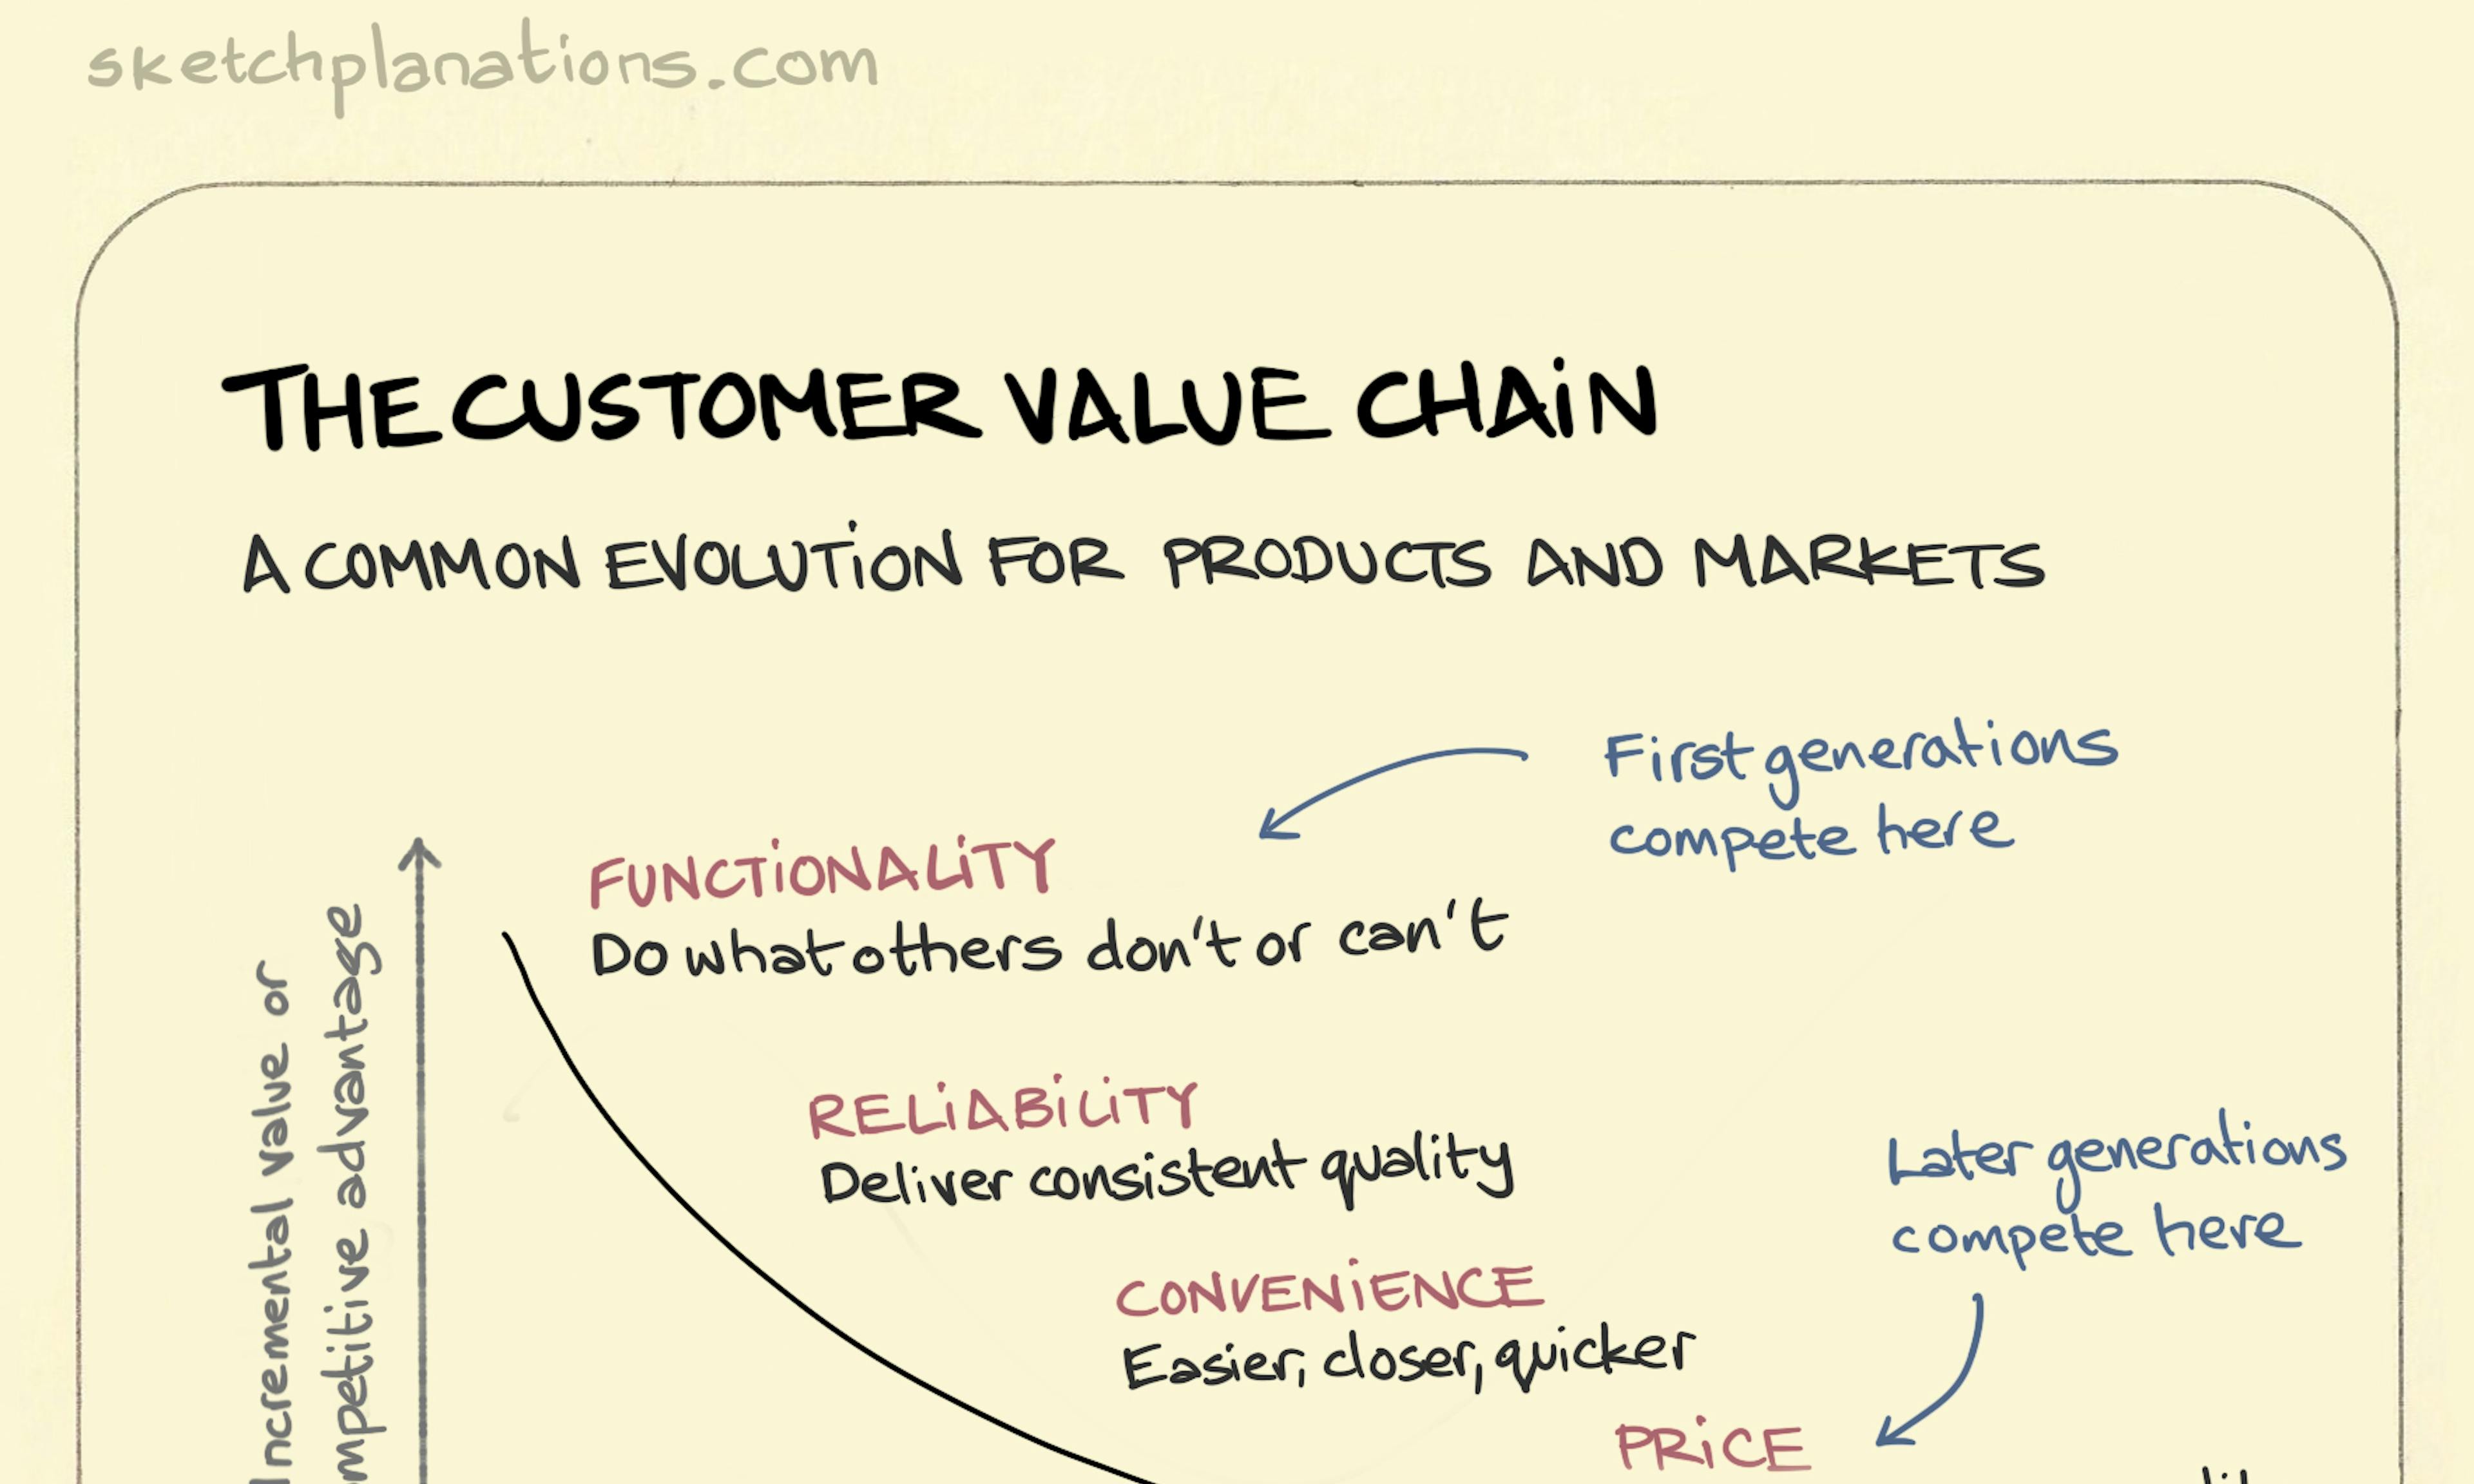
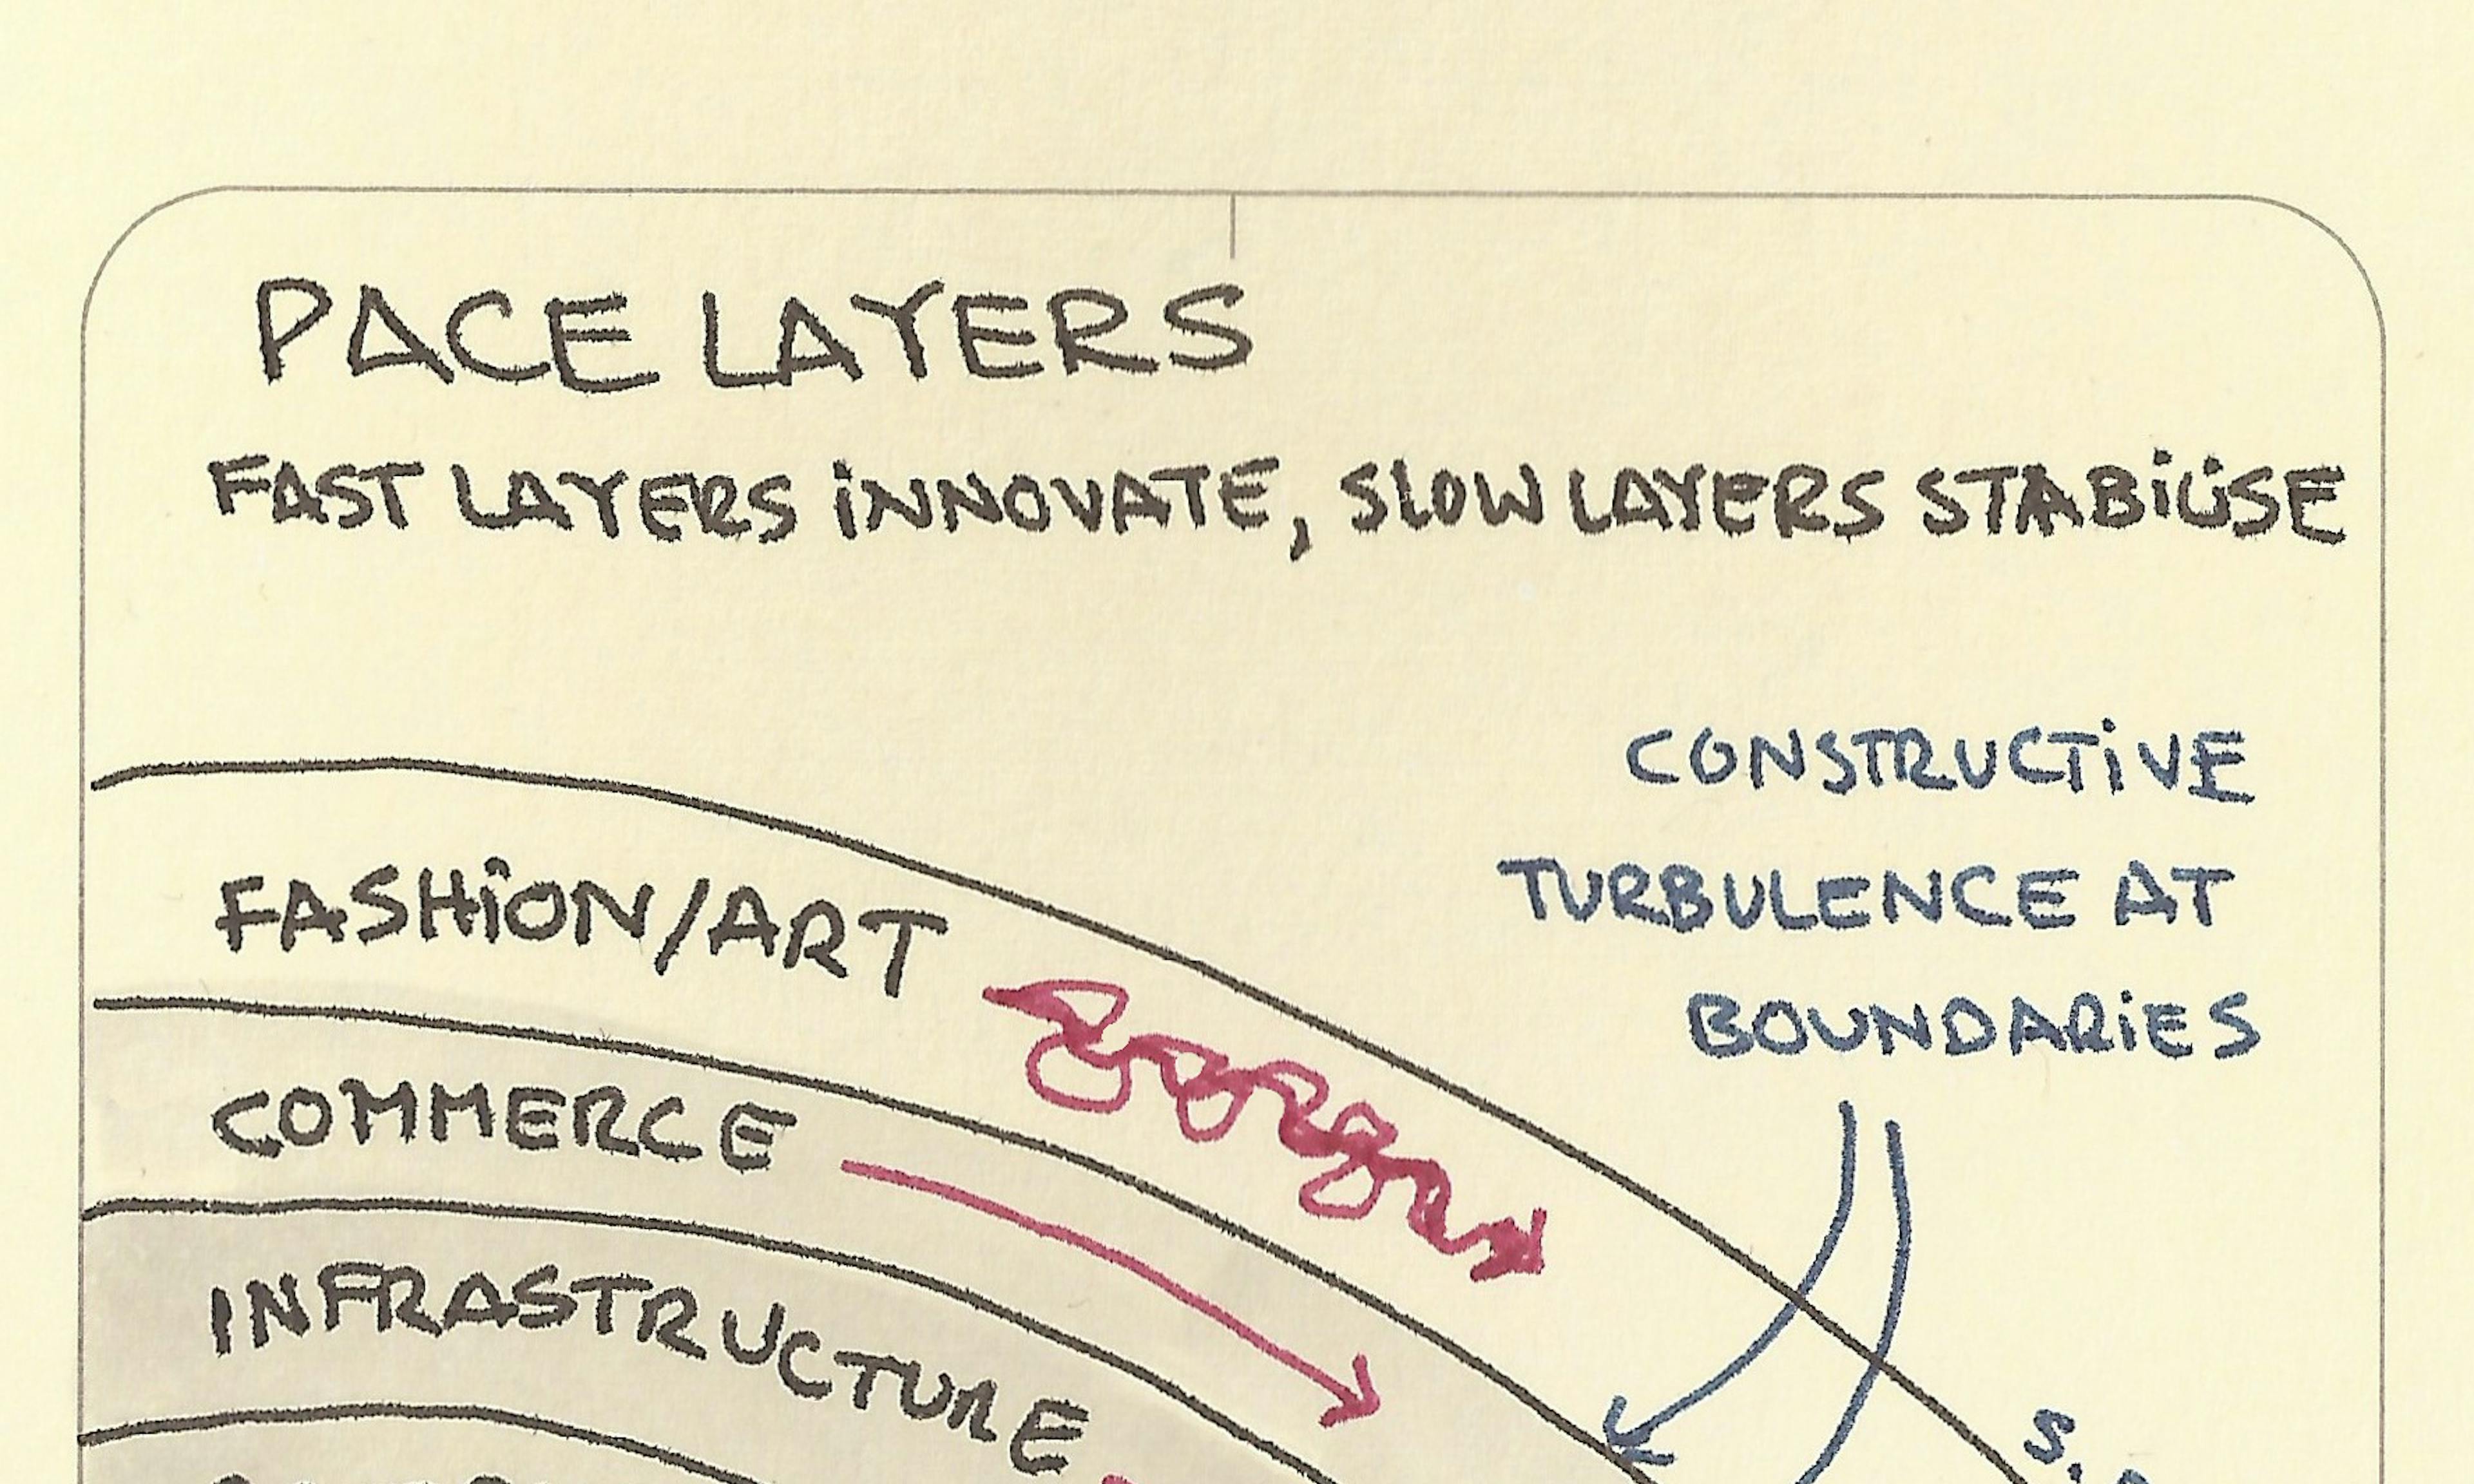
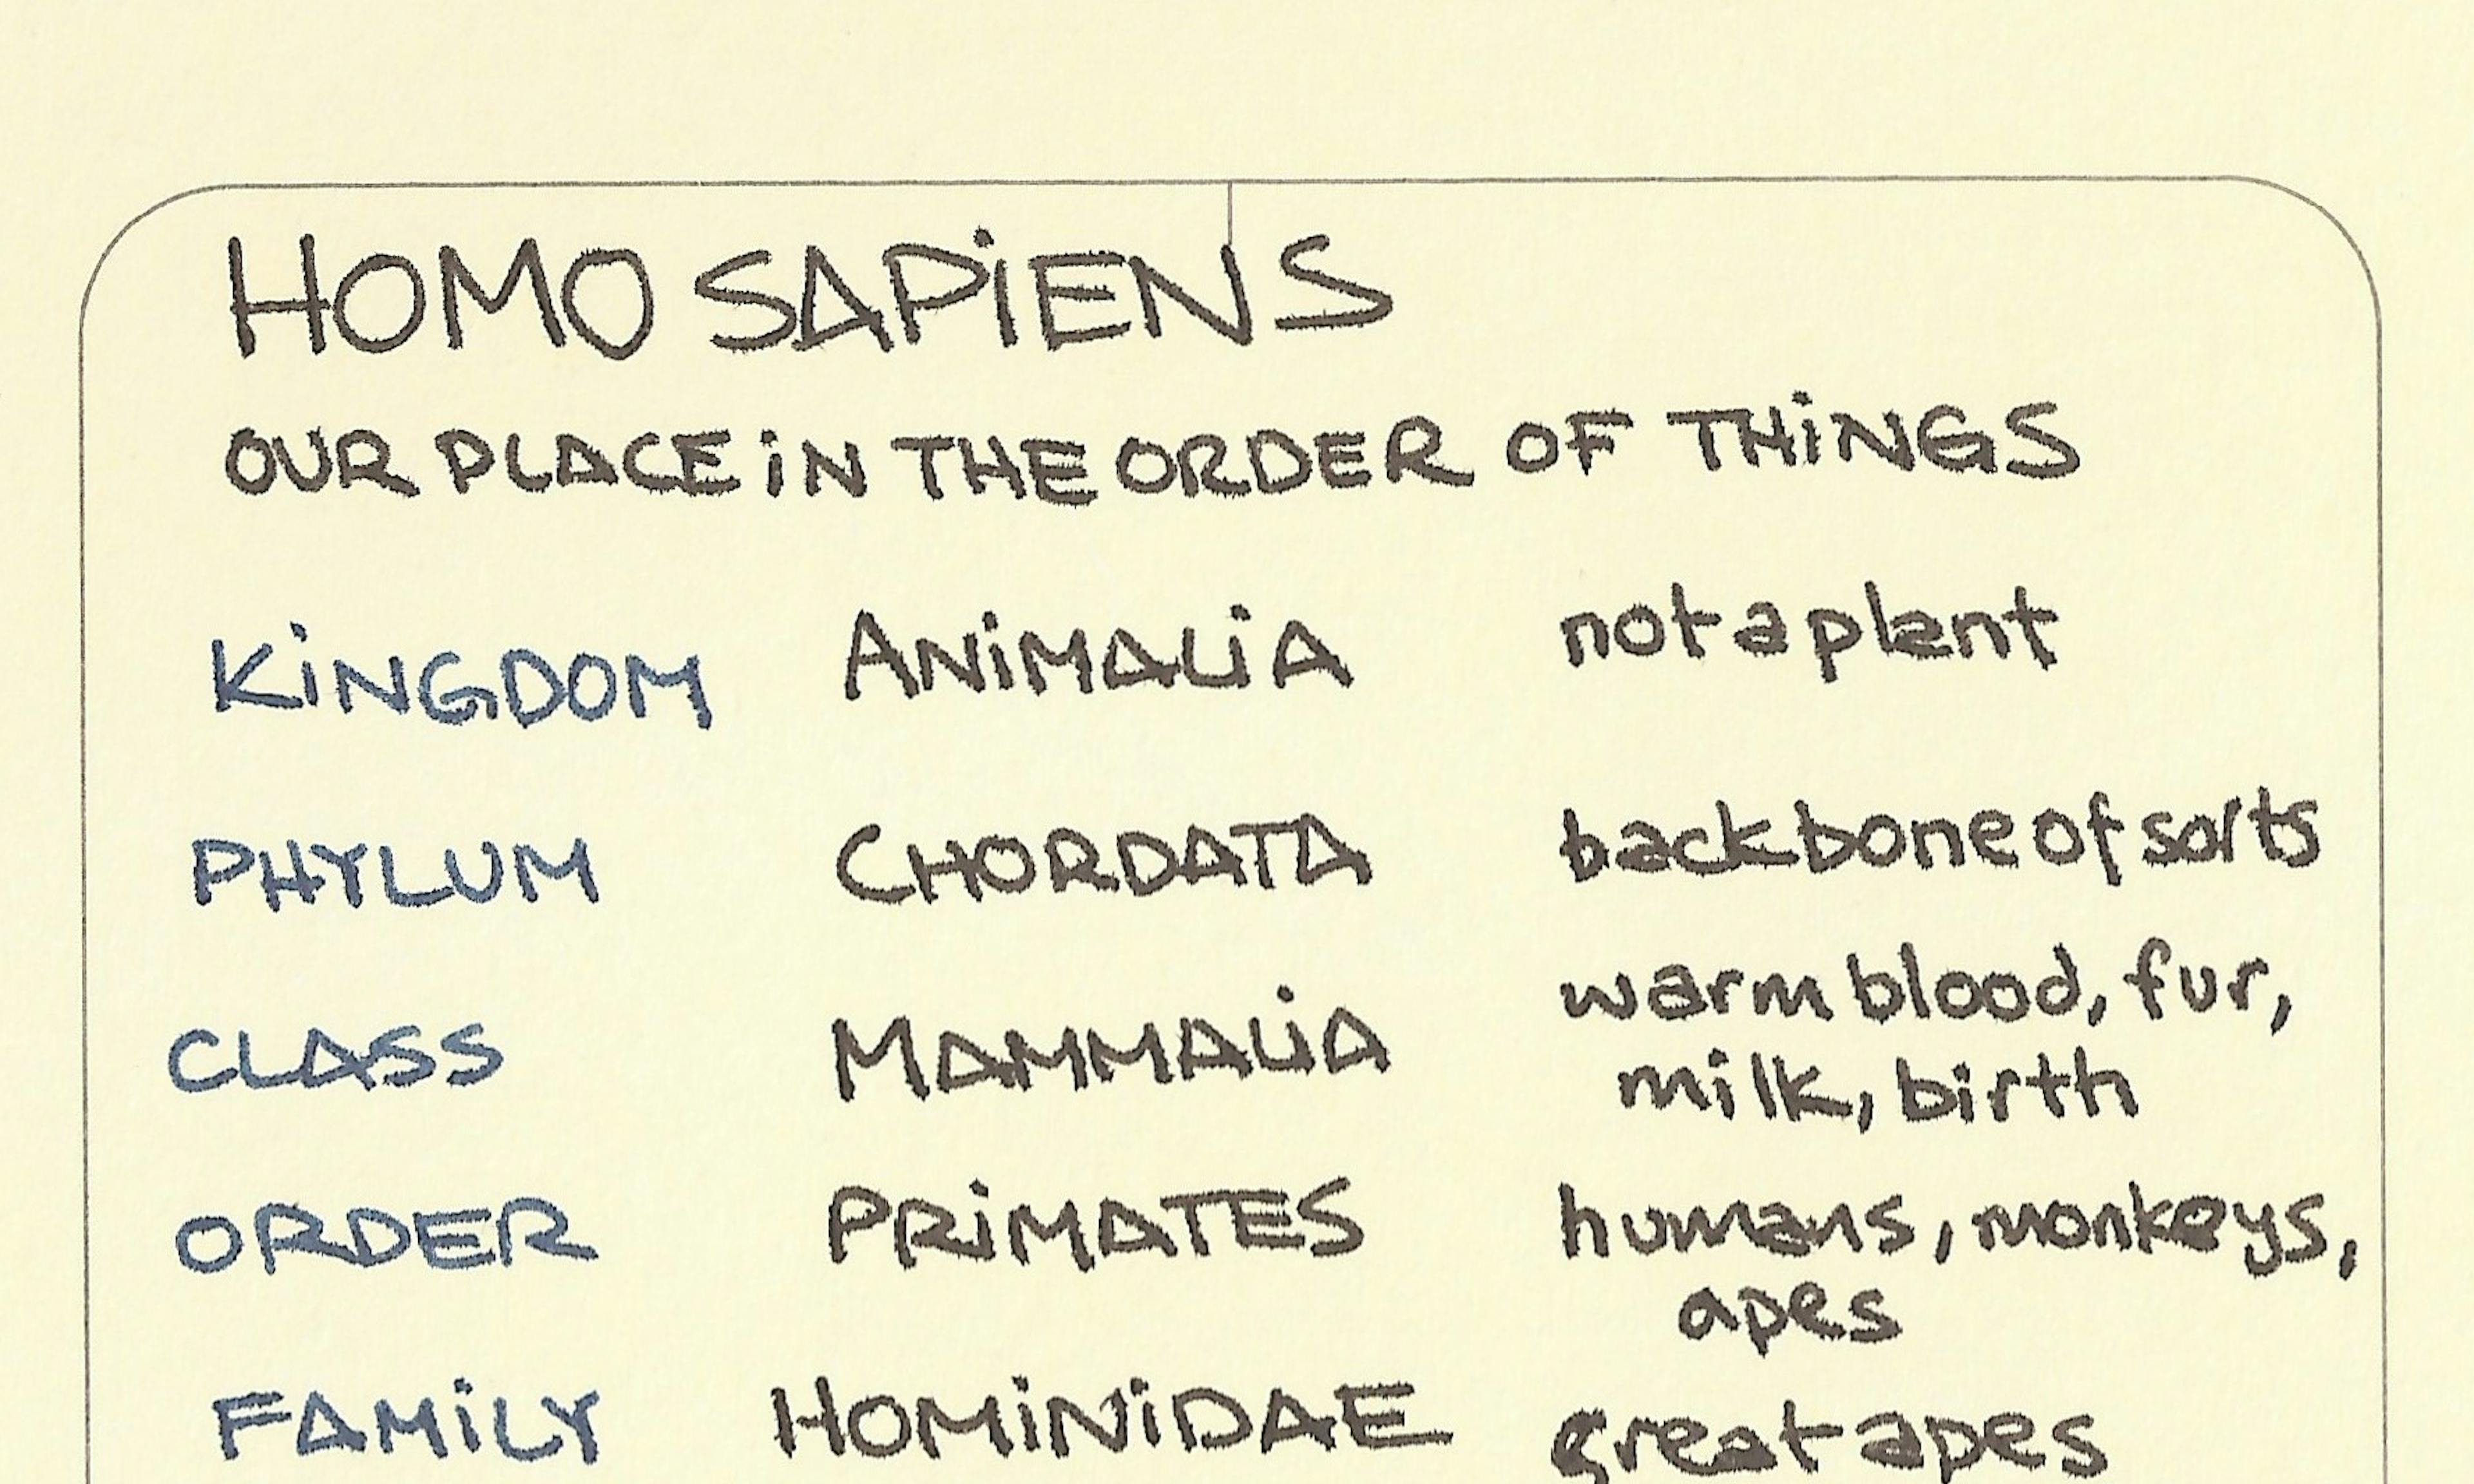
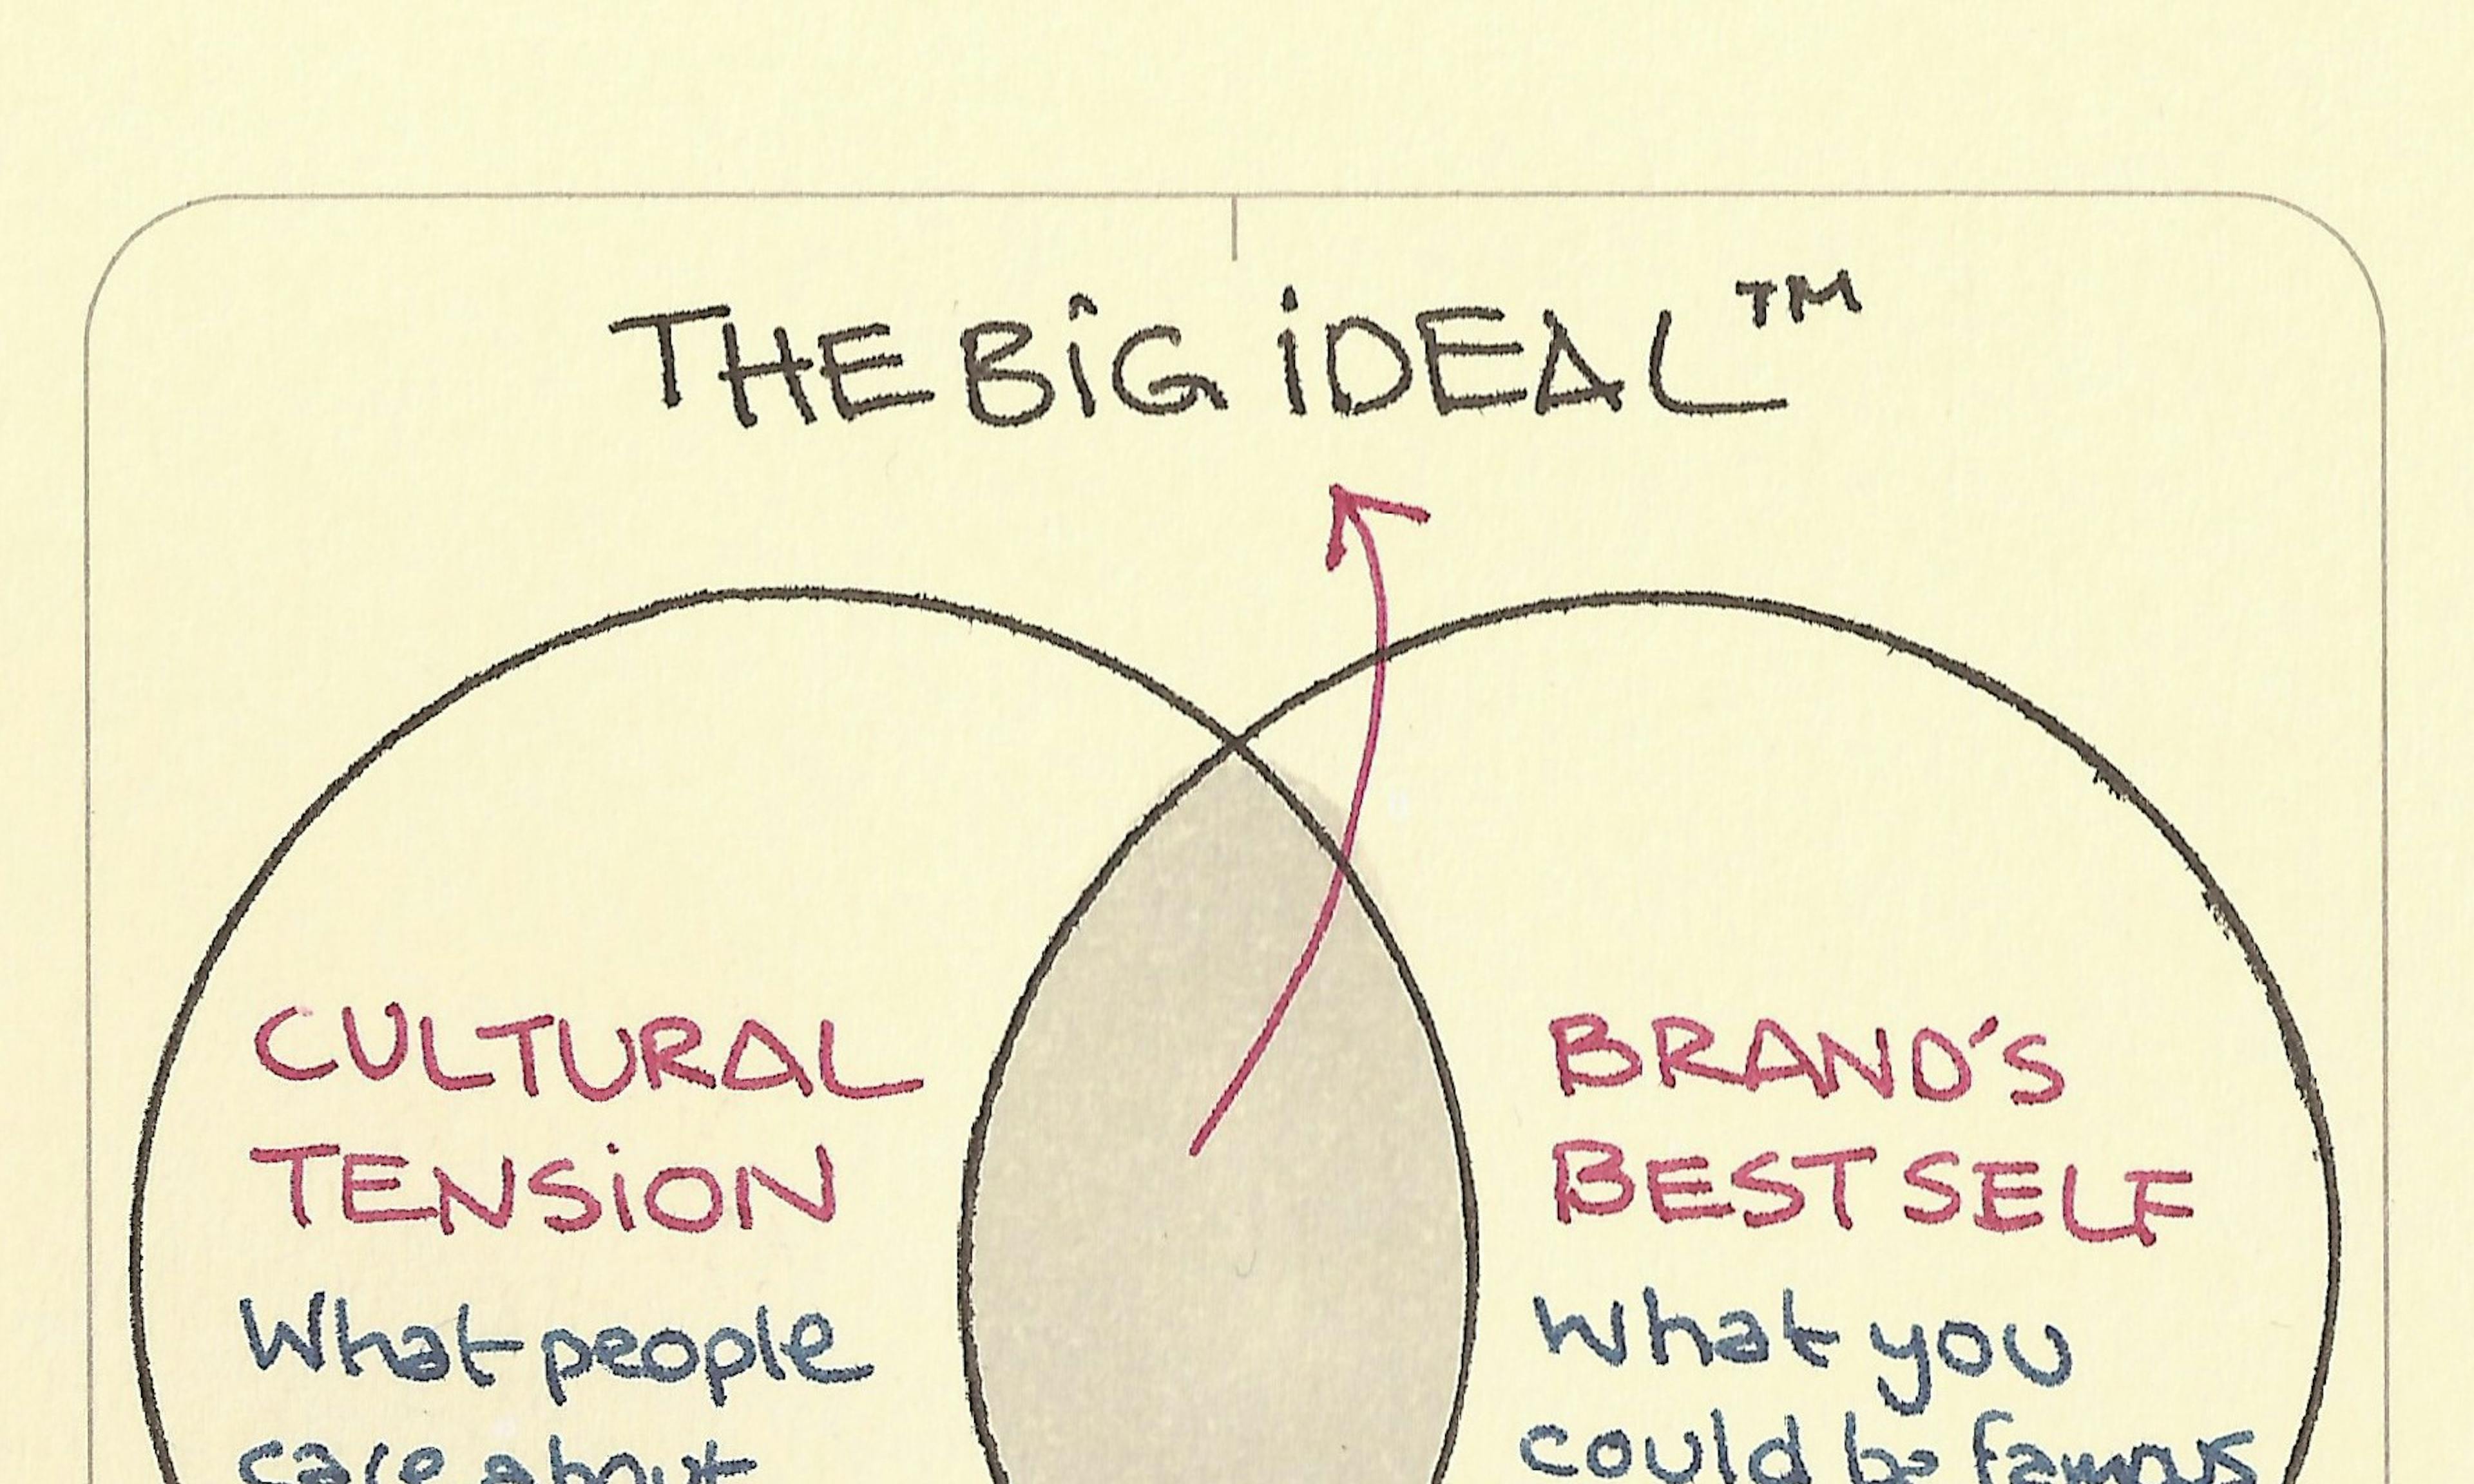
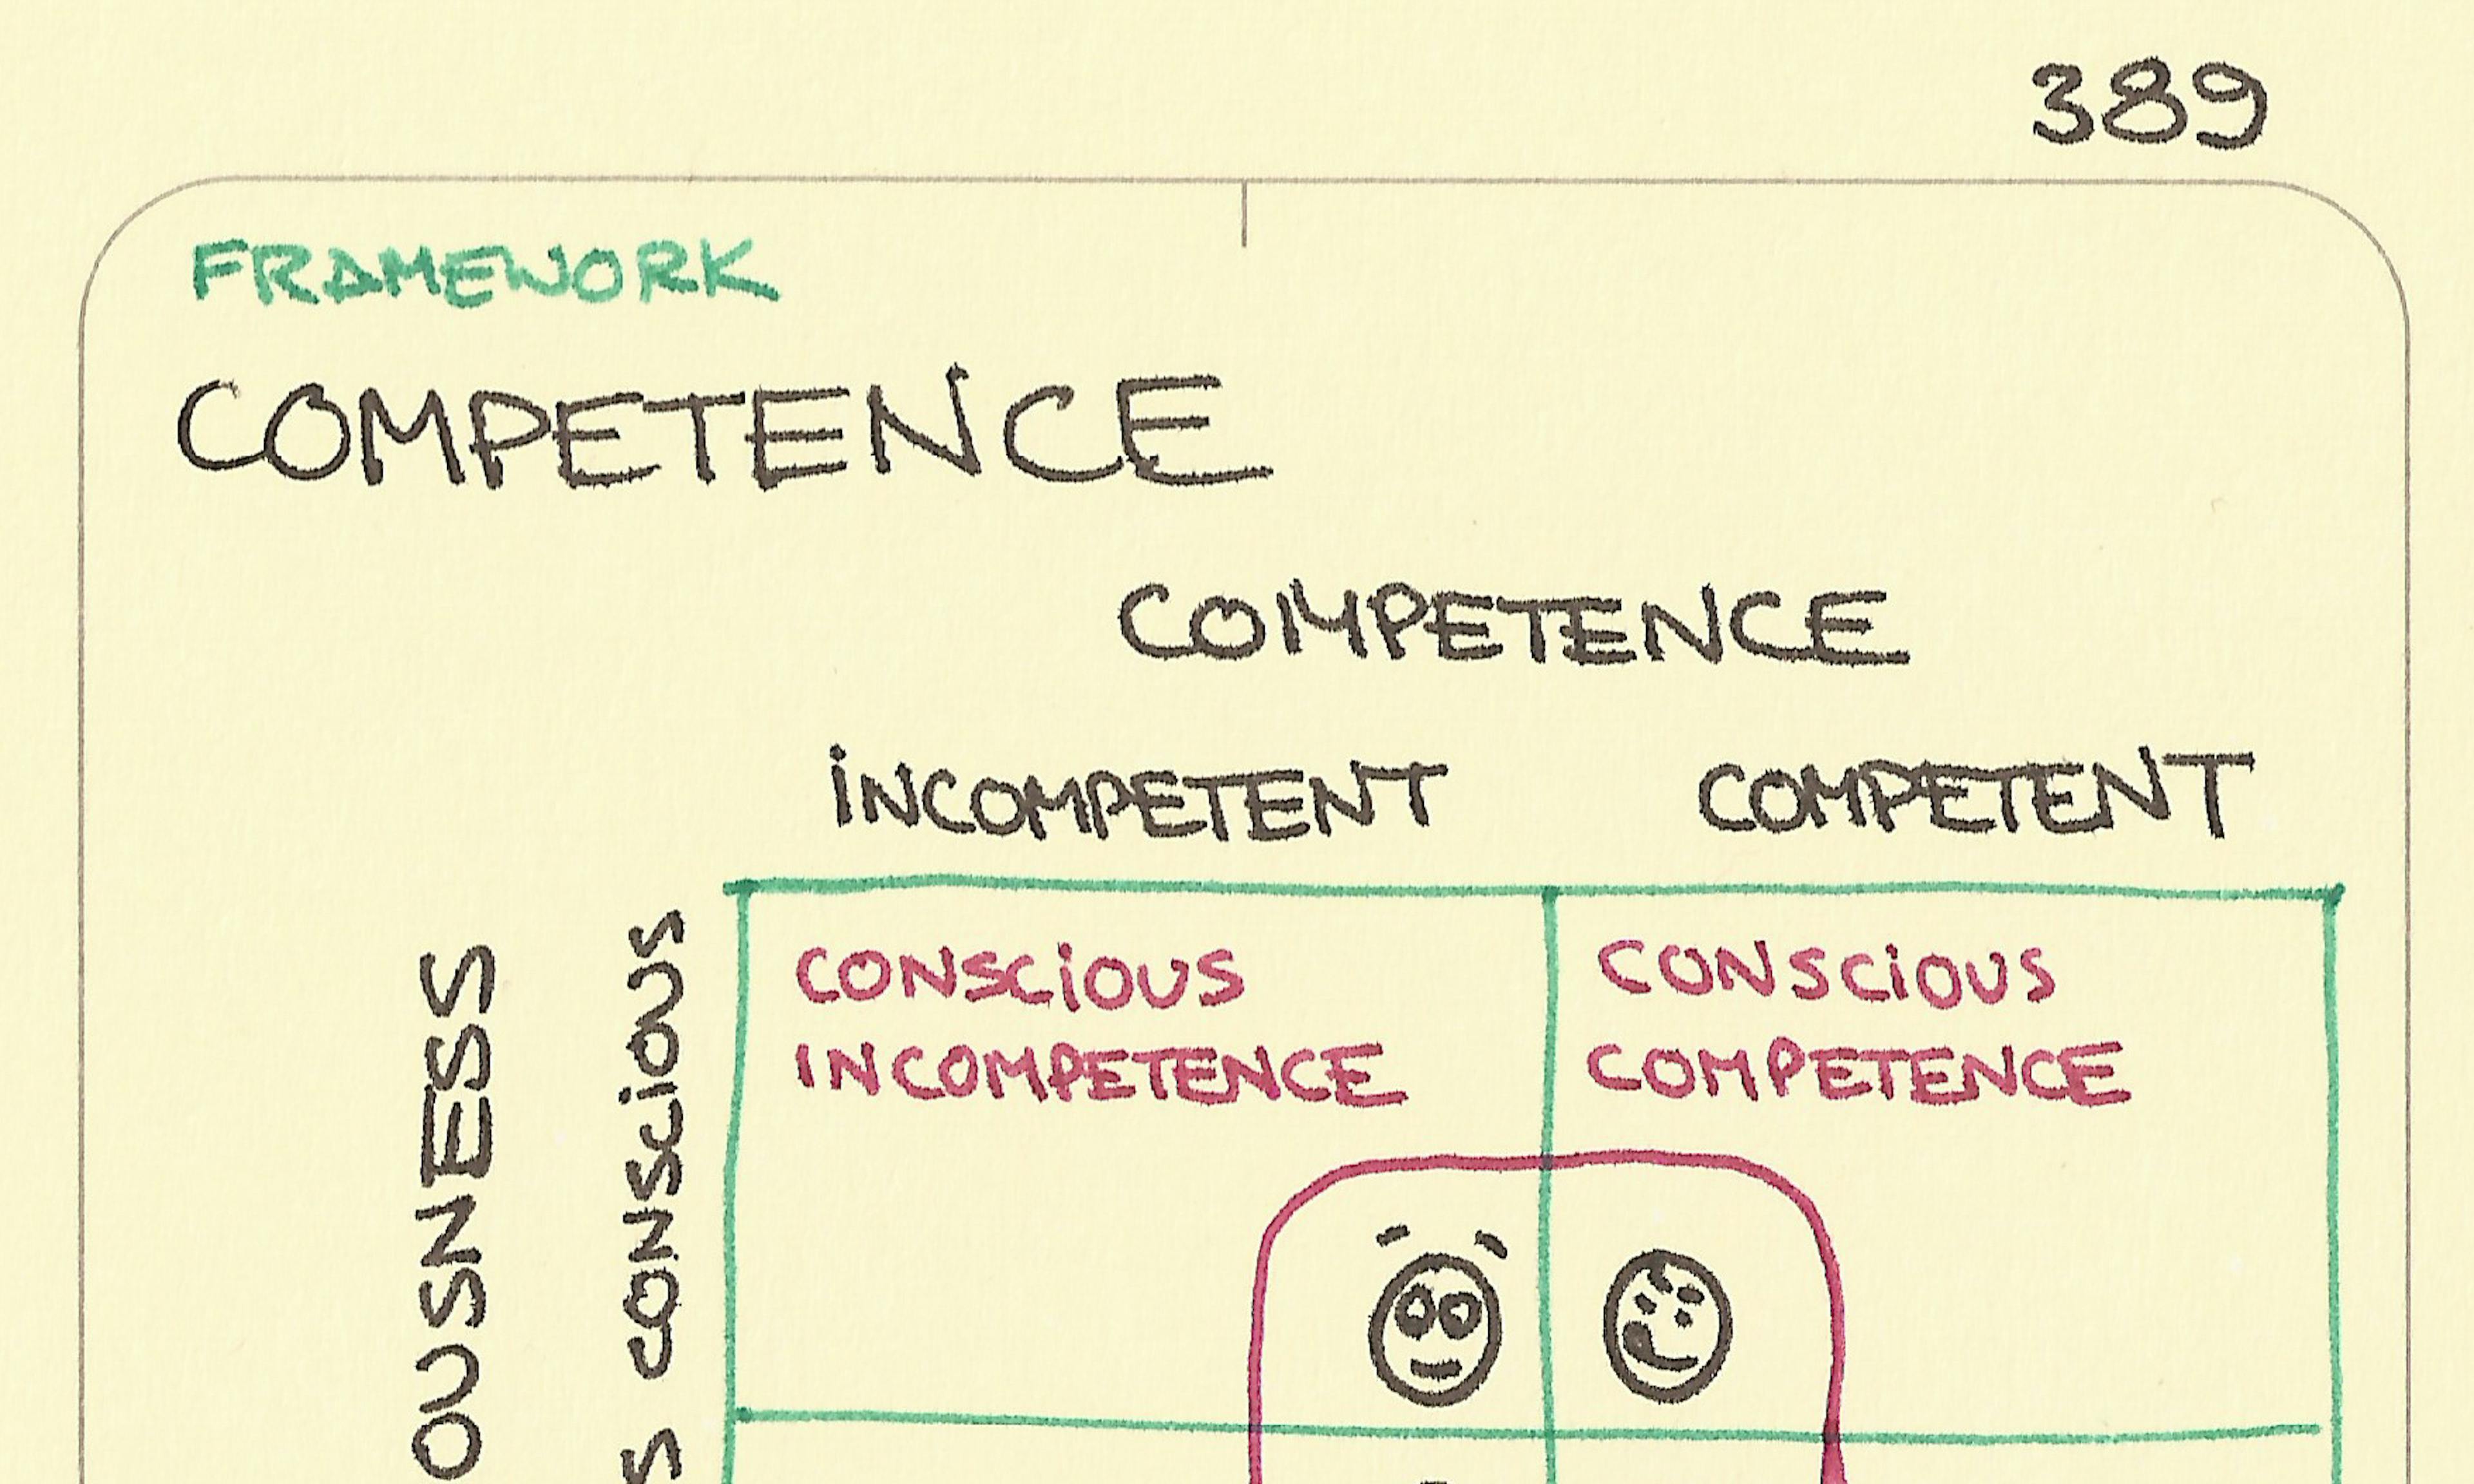
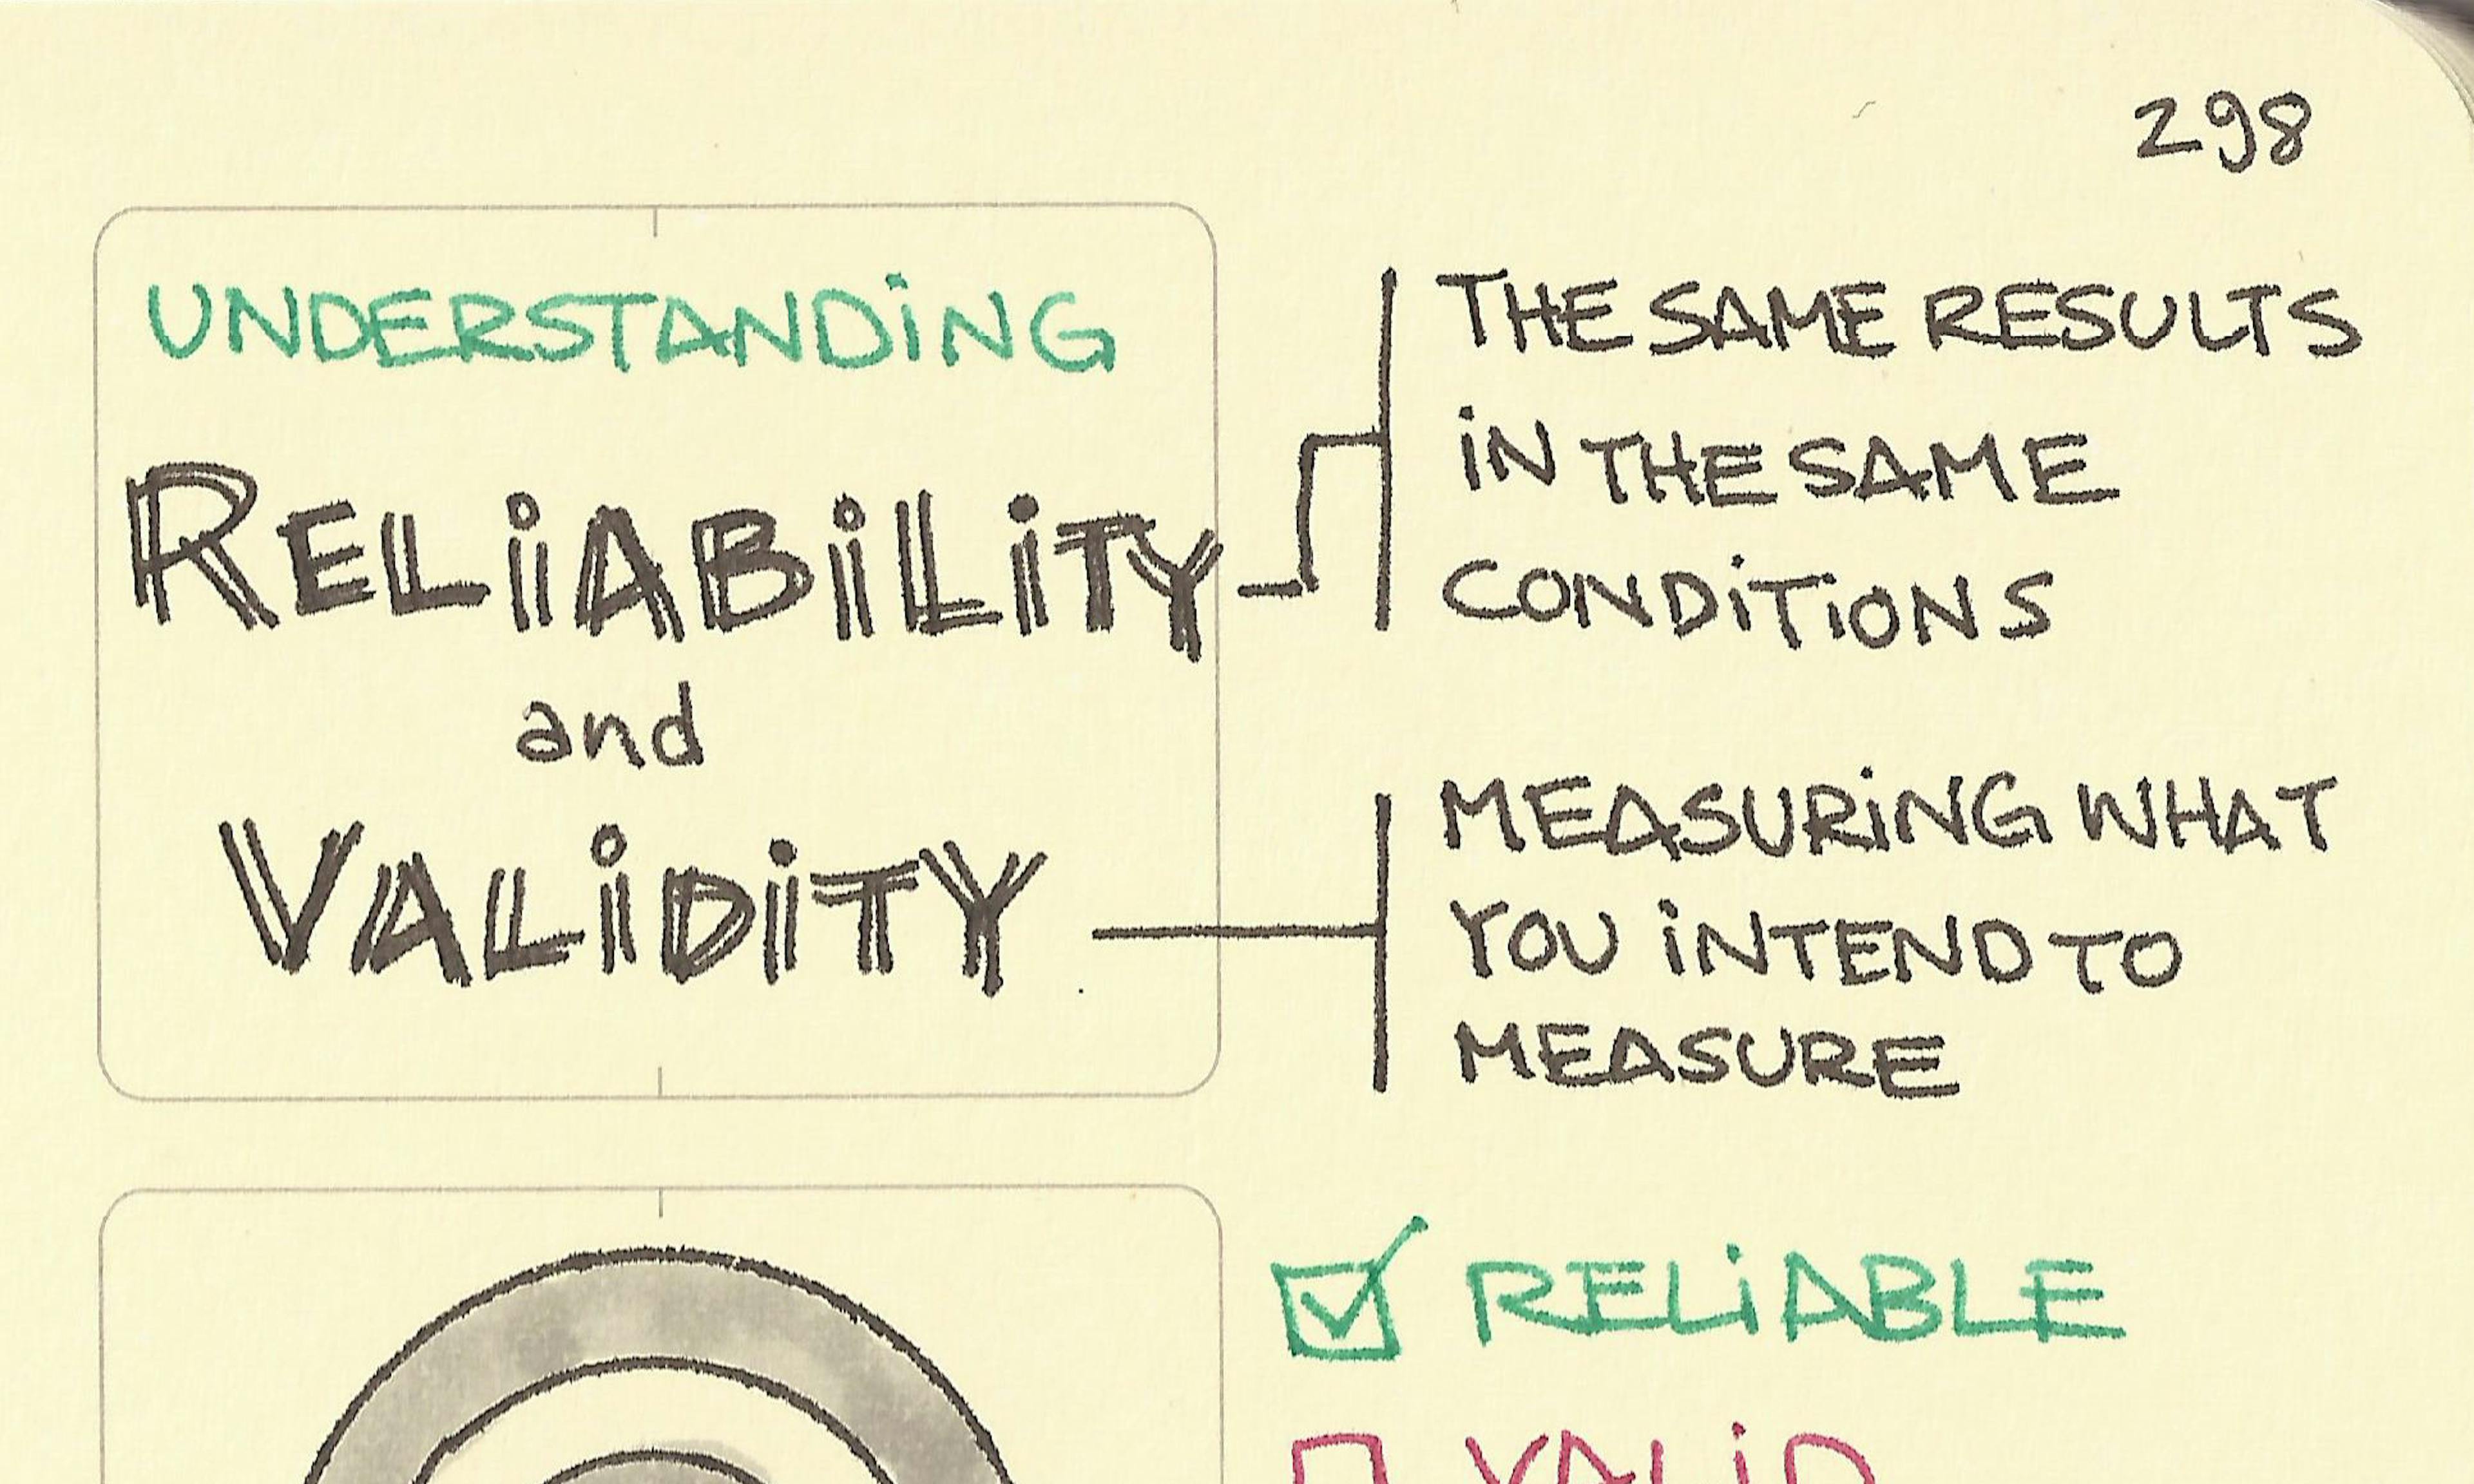
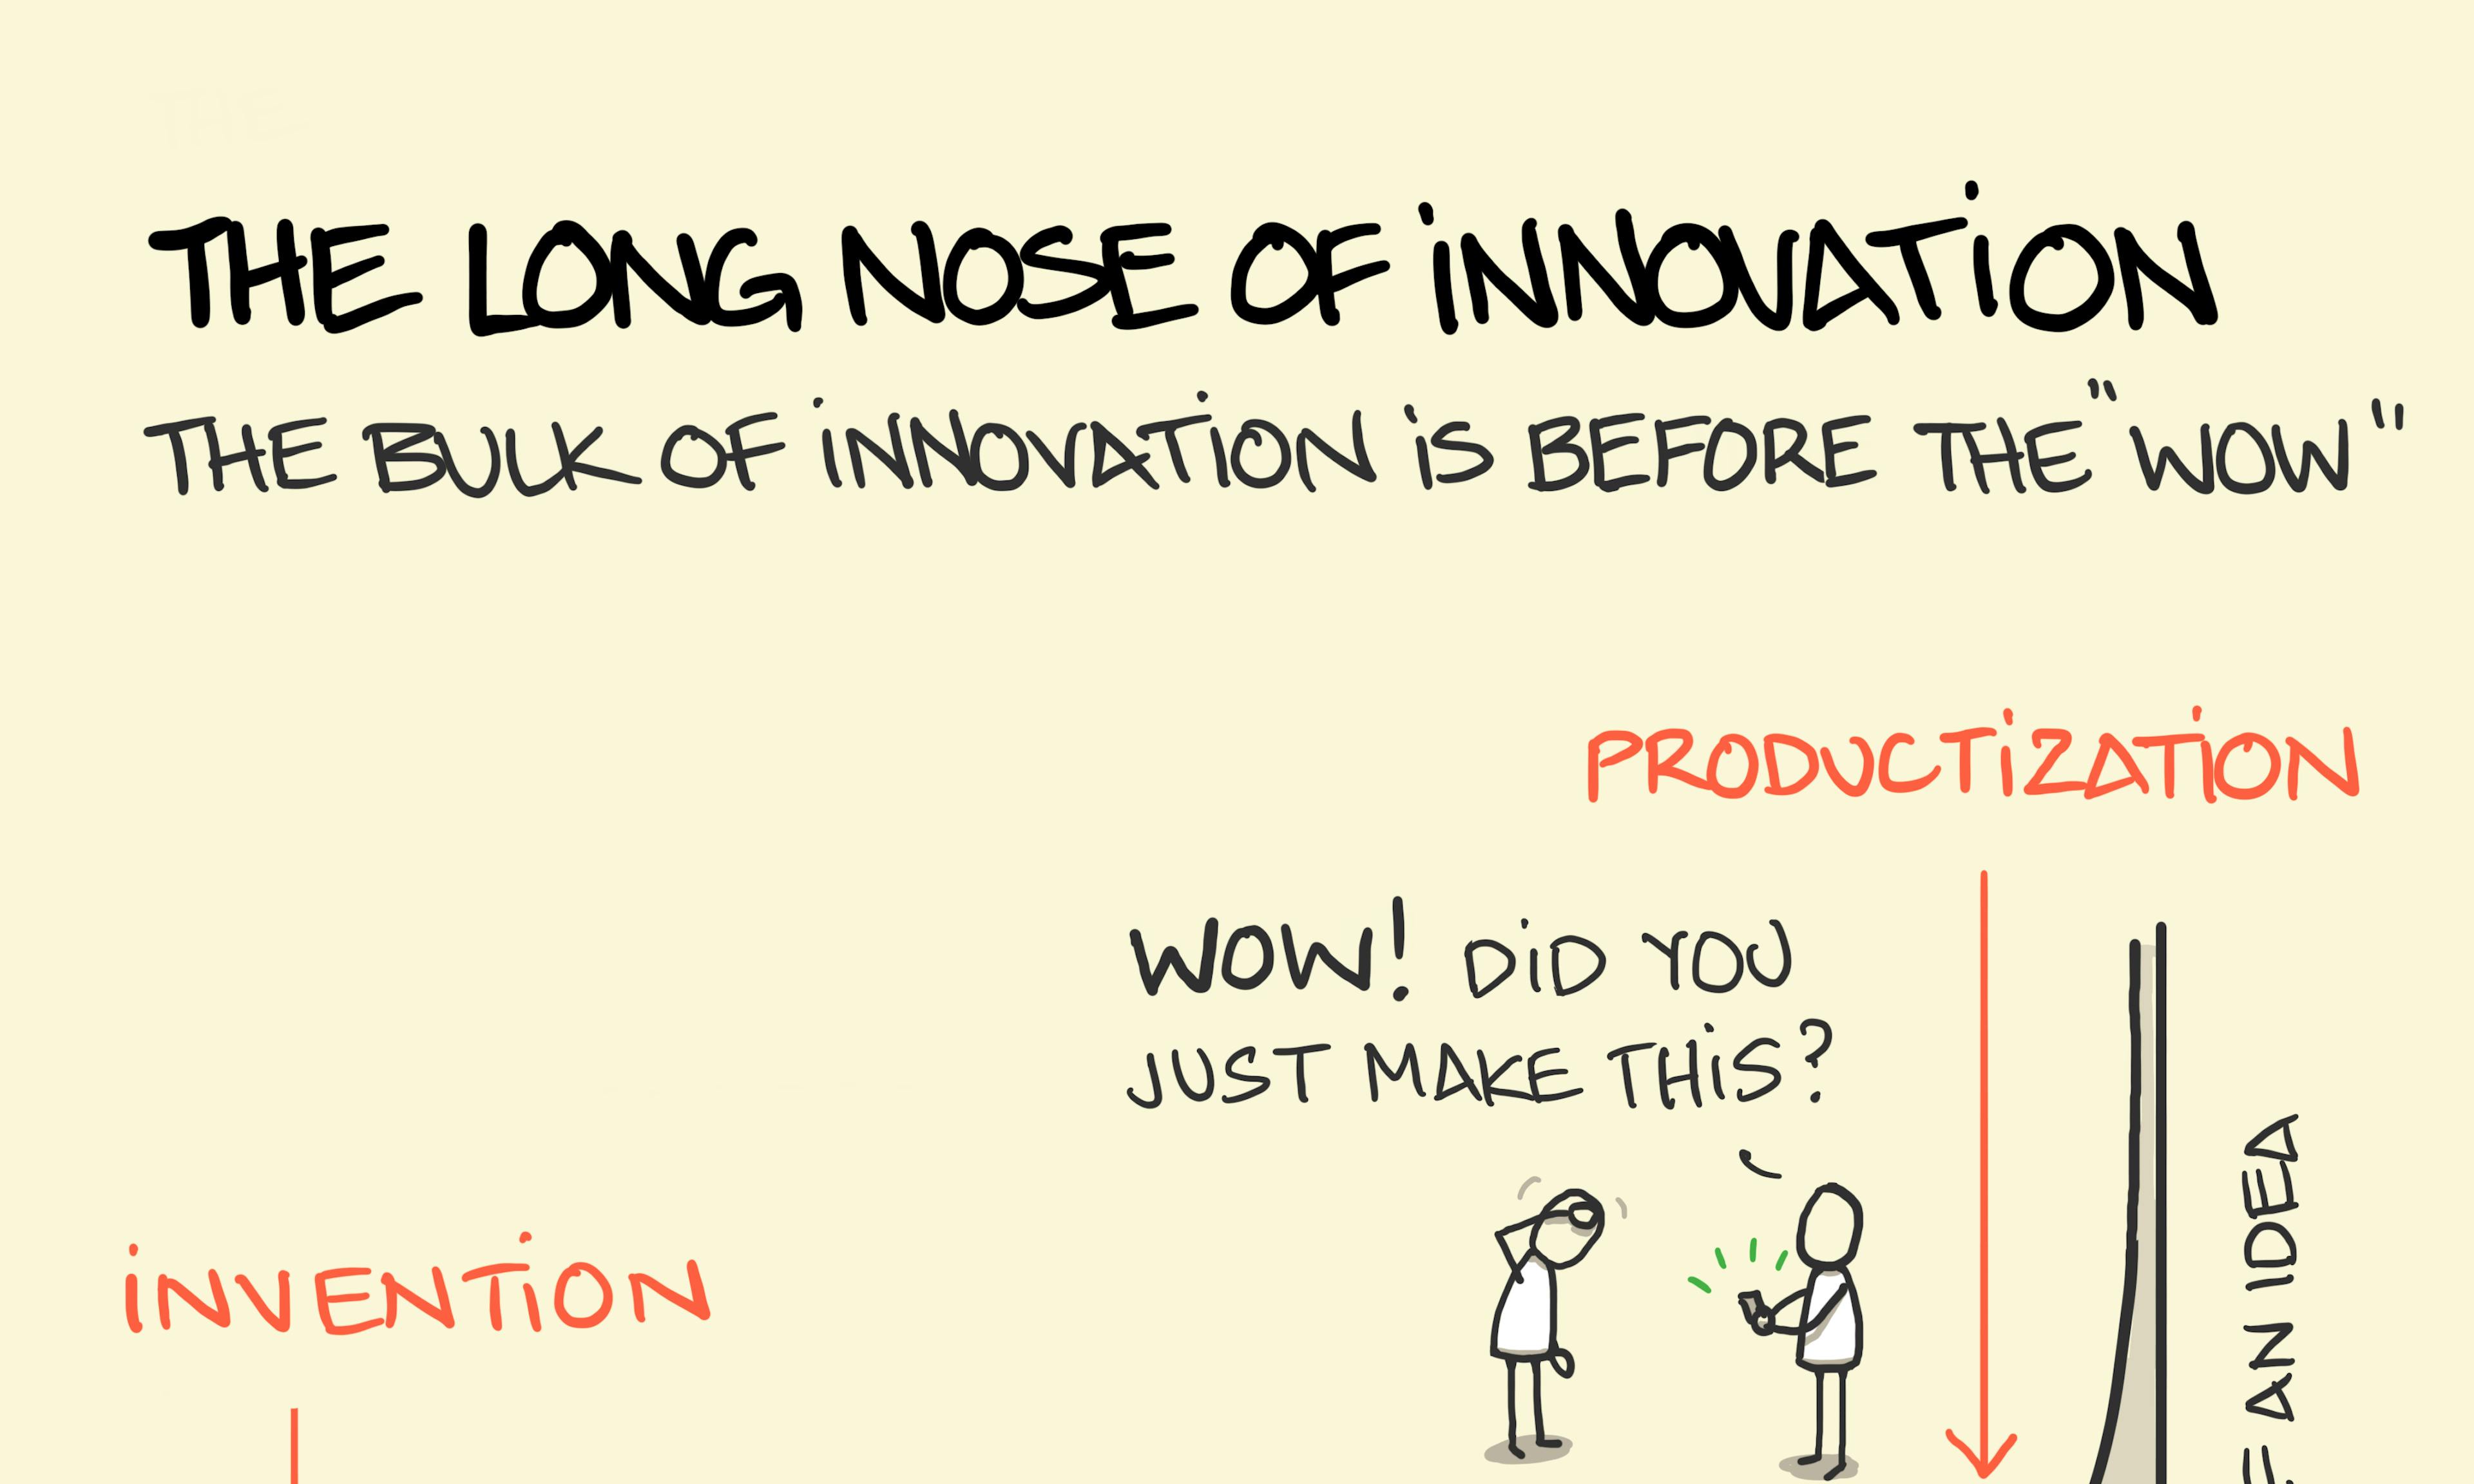
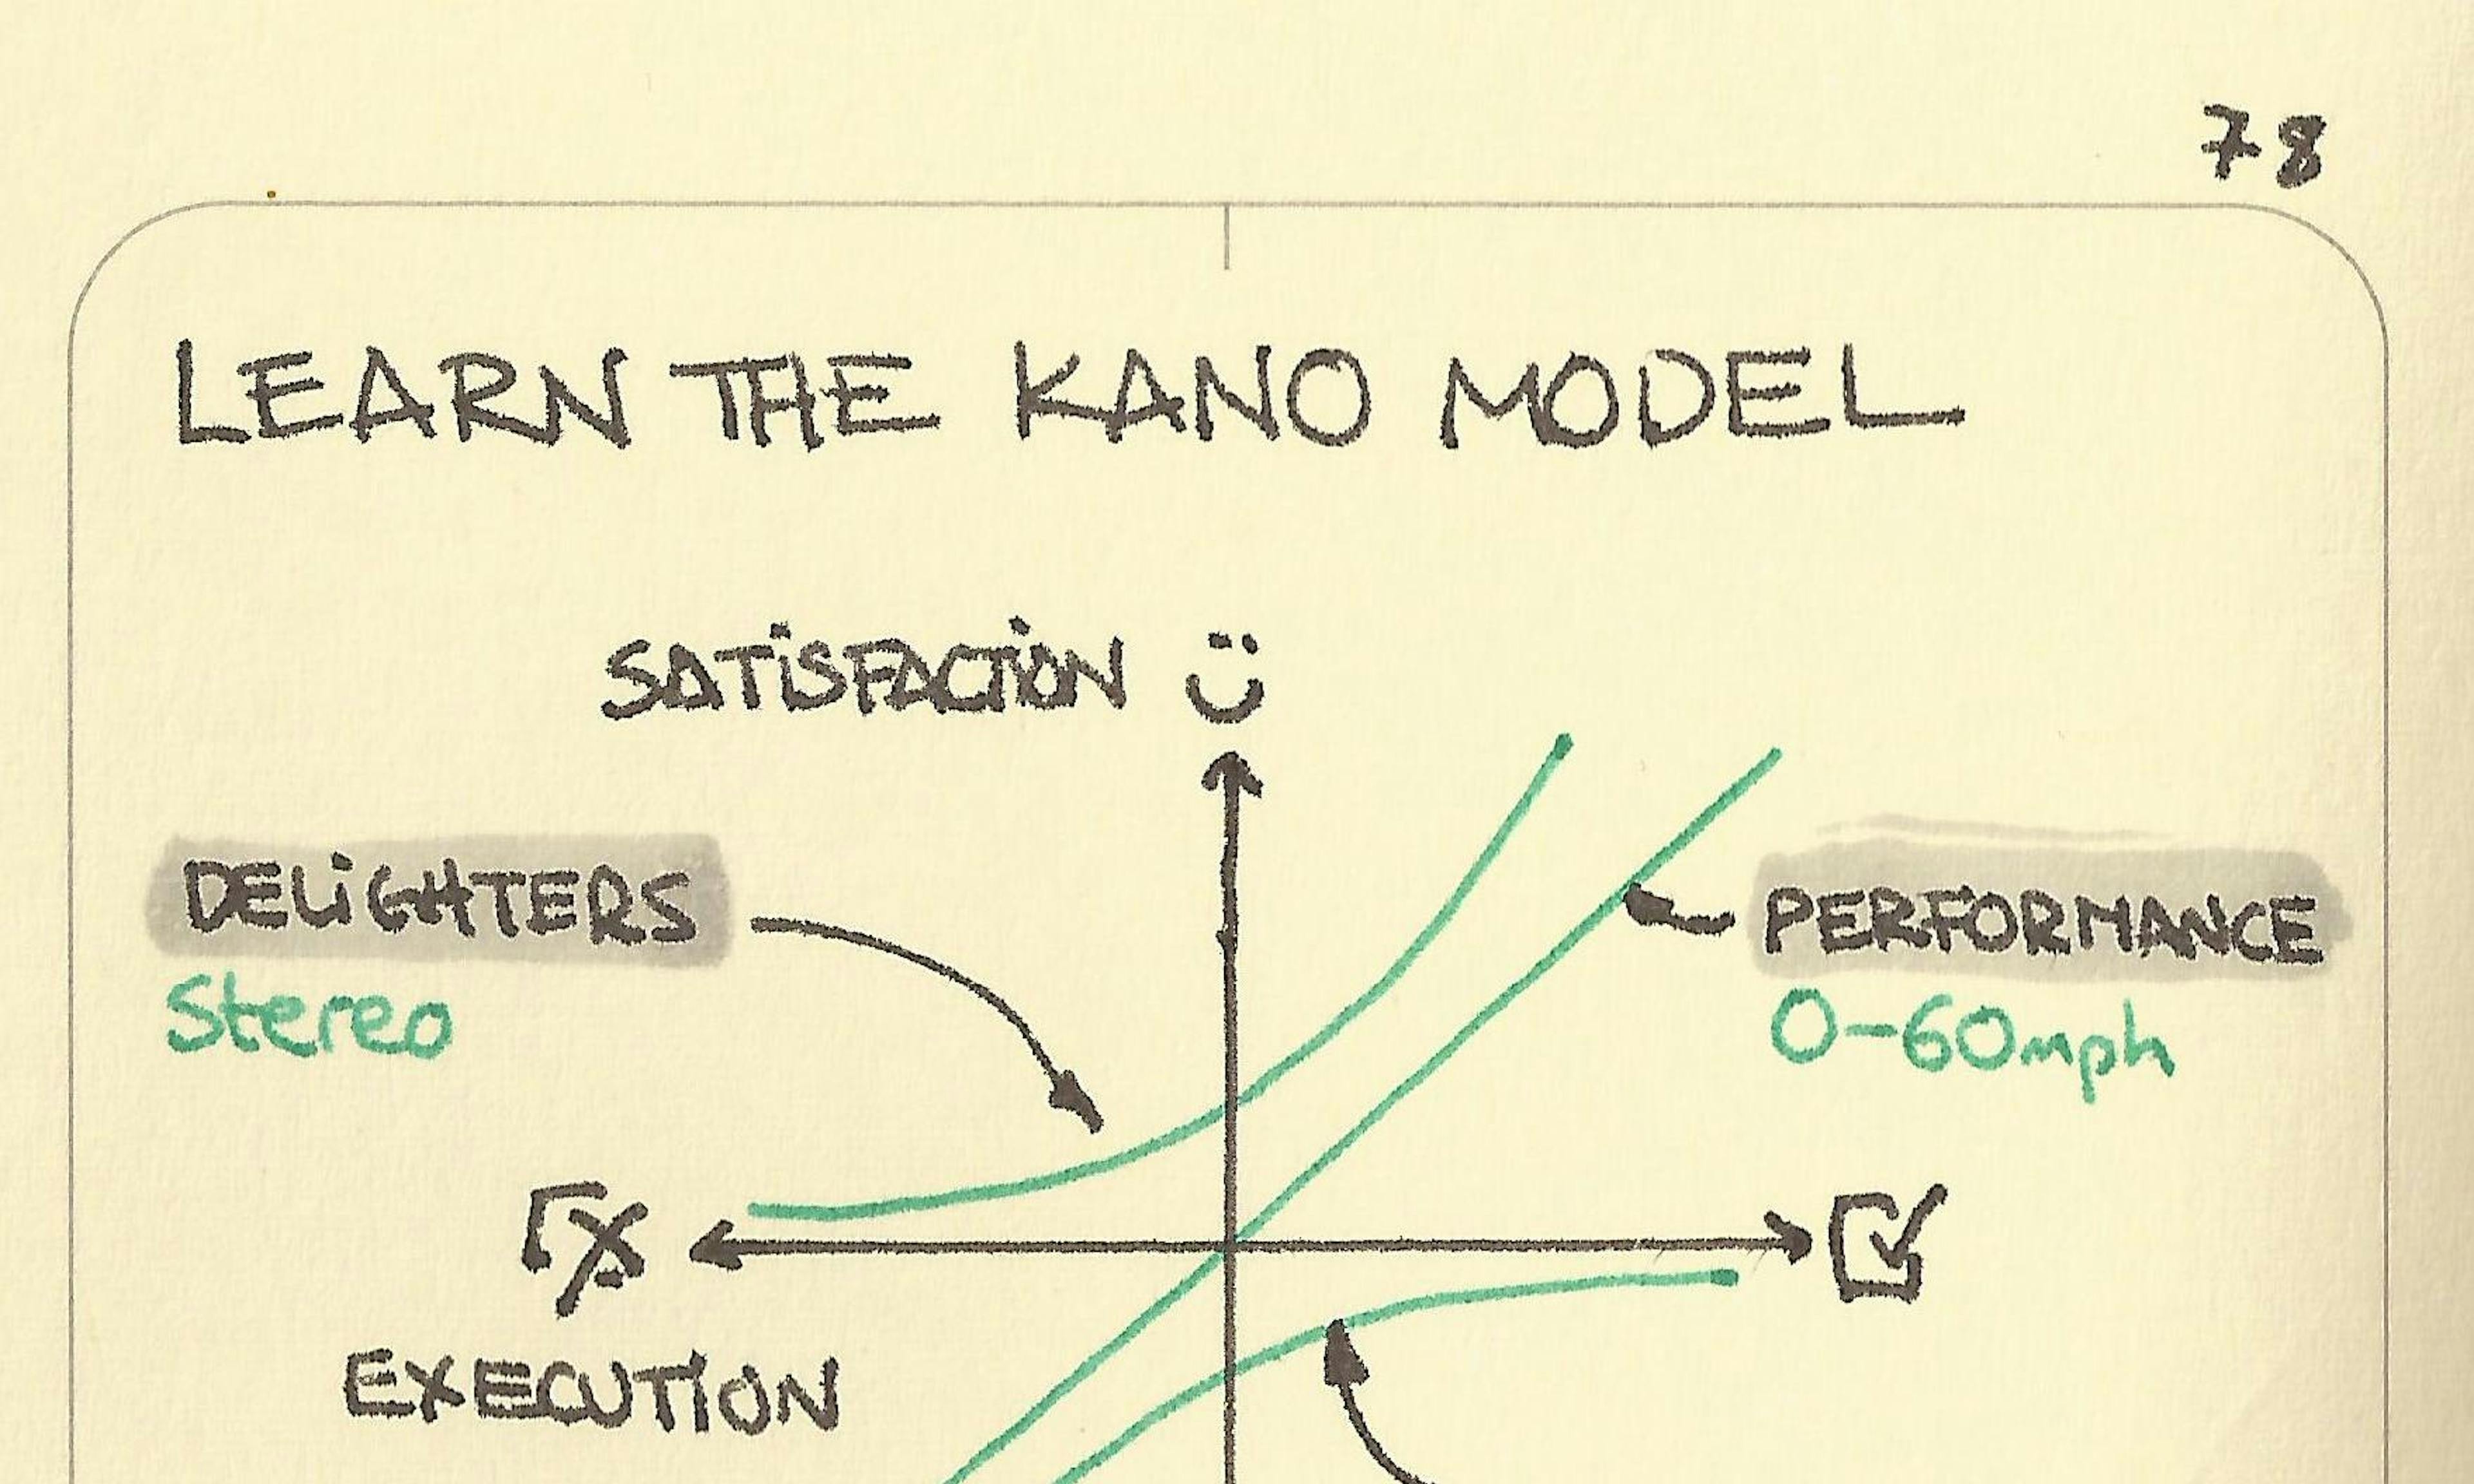
The upward spiral from Stephen Covey illustration: showing a spiral growing from the bottom with Learn Commit Do repeating as it rises and someone reading a map, packing their gear and heading off determinedly on a trip illustrating each stepThe Upward SpiralThe Pyramid Principle - Barbara Minto: a muddled message of a burst water main becomes clear that the school is closed when someone uses the pyramid principleThe Pyramid PrincipleVUCA illustration: Examples of Volatility (a stock-like chart), Complexity (a circuit-like confusion), Uncertainty (a direction splitting into 3) and a person sweating over Ambiguity (a Necker cube).VUCAThe Overton Window illustration: with the example of two children lobbying their parents on bedtime policies and the range of politically acceptable ideasThe Overton WindowTwo houses showing different approaches to heating: heating people and heating spacesHeating people, heating spacesThe side of a pyramid of needs: physiological, safety, love-belonging, esteem, self-actualizationMaslow's hierarchy of needsBlooms Taxonomy explanation: A series of 6 building blocks are stacked on top of each other, decreasing in size as they go up, creating a pyramid-style construction. Each block represents one of 6 thinking skills. These skills become more sophisticated as the pyramid climbs and reminds us that the foundation of learning is knowledge. Bloom's TaxonomyA funnel of dots of information emerge as a shining ball of wisdom at the bottom — the DIKW chainData Information Knowledge WisdomThe Swiss Cheese Model illustration: A stack of 4 vertical Swiss cheese slices act as safeguarding protective layers, keeping a young family on the right of the stack safe from the harmful elements approaching from the left. Although the holes in the cheese slices allow penetration through some of the barrier, the multiple layers, with unevenly distributed holes,  prevent harmful elements breaking all the way through.  The Swiss Cheese ModelRACI framework illustration: A family making a sandcastle highlights who is Responsible, Accountable, Consulted and InformedRACIHope: CR Synder's model for hope illustrated by a climber looking at The Ogre mountain considering the goals, pathways, and willpower that gives them hope they can climb itHopeSexy value illustration: the Venn diagram overlap of better and cheaperSexy valueAnalytics Maturity illustration: A young character is very happy, sat at their makeshift lemonade stand next to the sidewalk. When they close their stand, our young entrepreneur can assess their performance today using hindsight and insight to inform preparation through foresight for next weekend. Analytics maturity'Find your why not' Venn diagram with 3 equally overlapping circles for different types of work. Work that: feeds you, feeds the world, feeds my soul. You don't have to aim for the centre.Find your why notThe accountability ladder explained: A child explains to a parent why homework wasn't done, illustrating each rung of increasing accountability on the accountability ladder from a victim mindset to a powerful accountable oneThe accountability ladderThe Business Flywheel illustration: the model of The Business Funnel, where prospects are filtered to yield end customers is compared with The Business Flywheel, where customers are at the centre, acting as the driving force behind your business momentum. The business flywheelWhat is the Fun scale explained showing Type 1 fun as skiing, Type 2 fun as mountaineering and Type 3 fun as surviving a bear encounter (the best story)The fun scale: understanding the types of funA little bit of slope makes up for a lot of Y-intercept illustration: on a line graph, a red line starts well below the blue line, but over time, it overtakes and surpasses the blue line because it has slightly more gradient to it. A little bit of slope makes up for a lot of y-intercept.Second cousins once removed illustration: a family tree is displayed with YOU in the middle where the relationships with all those around you is labelled. Second cousins once removed.What is 2 Factor Authentication: a Venn diagram of three intersecting circles containing things you know, things you have and things you are. Where any 2 circles overlap, there is an opportunity for 2-factor authentication.  2 factor authenticationMatrix of spelling and sound showing the place of homonyms, homographs, homophones, heteronyms, synonyms and antonymsHomonyms, homographs, homophones, heteronyms… The "virtuous cycle" of Amazon and Uber illustration: closed loop flow diagrams demonstrate the effect of growth on factors like demand, price and service for Amazon and Uber. The ‘Virtuous Cycles’ of Amazon and UberOODA Loop explained: military strategist John Boyd's framework for action in conflict is shown as a closed loop cycle of Orient, Decide, Act, Observe and back to the beginning. The cycle also applies to business when you reconsider the points on the cycle as Frame, Strategize, Test, Gather. OODA LoopInverted pyramid writing illustration: giving a rowing sports example from the most important at the start to the details laterInverted pyramid writingThe golden circle: illustrated with the start with why circles, and Martin Luther King and the "I have a dream," not the "I have a plan," speechThe golden circleJohari window illustration: a 2 x 2 matrix of what's known to others plotted again what's known to oneself yields four possible scenarios. Johari window — a window of feedback and sharingThe Gartner Hype Cycle illustration: a line graph shows the typical curvy evolution of expectations from new technologies over time. The Gartner Hype cycleThe beard cycle illustration: a virtuous circle is shown where beards being rare in society (on the left) makes them more desirable which leads to beards becoming more common in society (on the right), making them less desirable, which leads to fewer beards again. And so on...   The beard cycleStrahler Stream Order animation: what looks like the silhouette of a tree with branches but no leaves, is actually a plan view of a large river network. Starting at the outermost, narrowest parts, each time two tributaries of the same order merge together the order of river size increases until it flows out into the sea. Strahler stream order: Streams, rivers, the Amazon and how to organise them.The customer value chain illustration: a concave up, decreasing line graph shows the different elements of competitive advantage at play as a new product or market evolves over time. The customer value chainGoldilocks Tasks: a spectrum where the challenge is not too easy, not too hard, but just right for flow and masteryGoldilocks tasksStages of griefMOSCOW Prioritisation.Plutchik's Wheel of Emotions: a colourful wheel showing how emotions mixMapping emotionsThe S Curve explained in a sketchThe S-curveThe virtuous cycle of exercise and sleep showing the loop of a tennis player exercising better, then sleeping better, then exercising better...The virtuous cycle of exercise and sleepPace Layers drawing showing the layers of Nature, Culture, Governance, Infrastructure, Commerce and Fashion/Art changing at different speedsPace layersBortle ScaleApproaches to asset valuation: the castles in the air approach and the firm foundations approachApproaches to asset valuation: Castles in the air and firm foundationsHomo sapiens. Our place in the order of thingsThe Big Ideal ™Prospect theoryThe importance/urgency matrixWhat’s the difference between mandarins, clementines, satsumas and tangerines?A 2 x 2 grid for competence and consciousness showing the progression between themStages of competence frameworkBest travel choices in LondonTravel and new foodsSix thinking hatsCommon distributions: normal, skewed, paretoUnderstanding reliability and validity9 WindowsPowers of 10Express - Test - CycleEnrich your design processPatnaik’s Hierarchy of NeedsMaslow’s Hierarchy of needsThe four pillars of too muchZone of proximal developmentThe law of lockers explained in a chart with the likelihood of your locker being on top of someone else's and how full the changing room isThe law of lockersDesigning for adoptionThe wedding bar goes up the more weddings you attendThe long nose of innovation explained showing the long period of refinement and augmentation before a wow moment of technology. The long nose of innovation theory is from Bill BuxtonThe Long Nose of InnovationThe knowledge funnelThe Third PlaceBuilding a good framework is like cutting cubes out of fog — Larry KeeleyLearn the Kano modelDo a 2x2On productivity and temperatureHit the product sweet spotA spectrum of feedback qualityThe tastes of victory and failurePick a presentGet good ideas
Buy Me A Coffee