

Analytics maturity
- Download
- Copied!
👇 Get new sketches each week
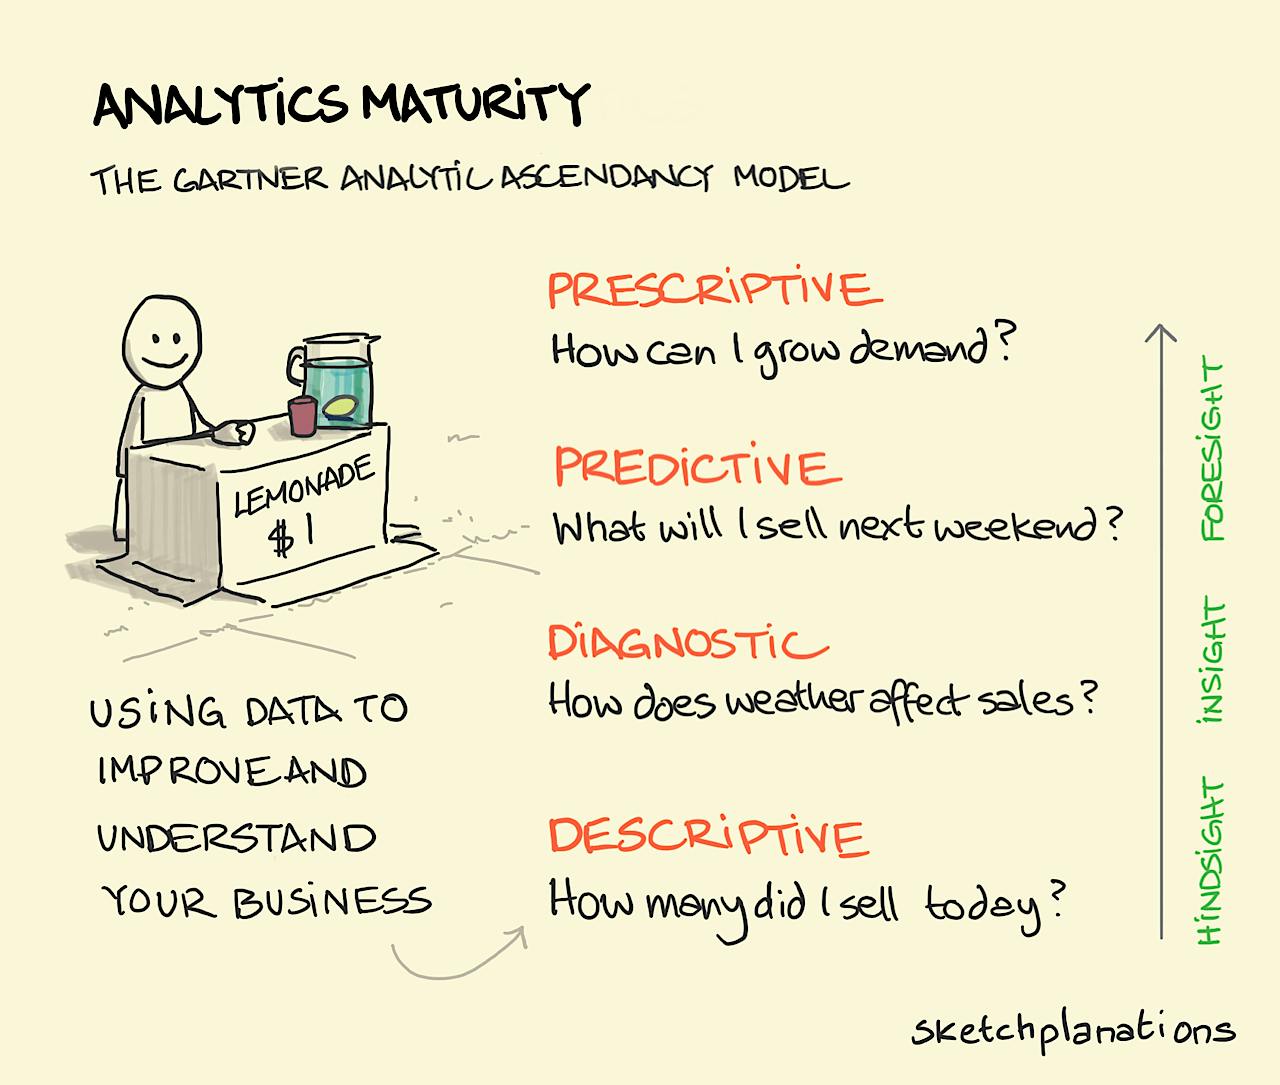
There are lots of questions you can ask of data. I like this model as it gives a framework for the different types of questions you might ask. It was introduced to me as the data science pyramid with descriptive analytics — measuring what’s happening — being the foundation on which others are built. You don’t have to go in order, but it’s a nice approach to consider how the questions you’re asking of your data might evolve.
To take our school Summer fête as an example, for a long time takings were all in cash and put into one bucket at the end for counting. You end up with one number for how much you raised. But you might move to collecting more descriptive data on the takings for each stall — whether the bar earns more than the tombola, for example. You then might be able to ask diagnostic questions like figuring out why one fête earned more than another with a different mix of stalls. If you know how many people came you might be able to make some predictions on the takings of a future fête based on number of people and stall types. And if you get fancy you might start to use your data to figure out how you could raise more money for the school in future.
There are many ways to slice and dice data and the questions you ask, but I like the clarifying simplicity of this one.
As far as I know, the framework is the Analytics Ascendancy model, or Analytics Value Escalator, or other such business sounding name from Gartner.
