Mathematics in Everyday Life
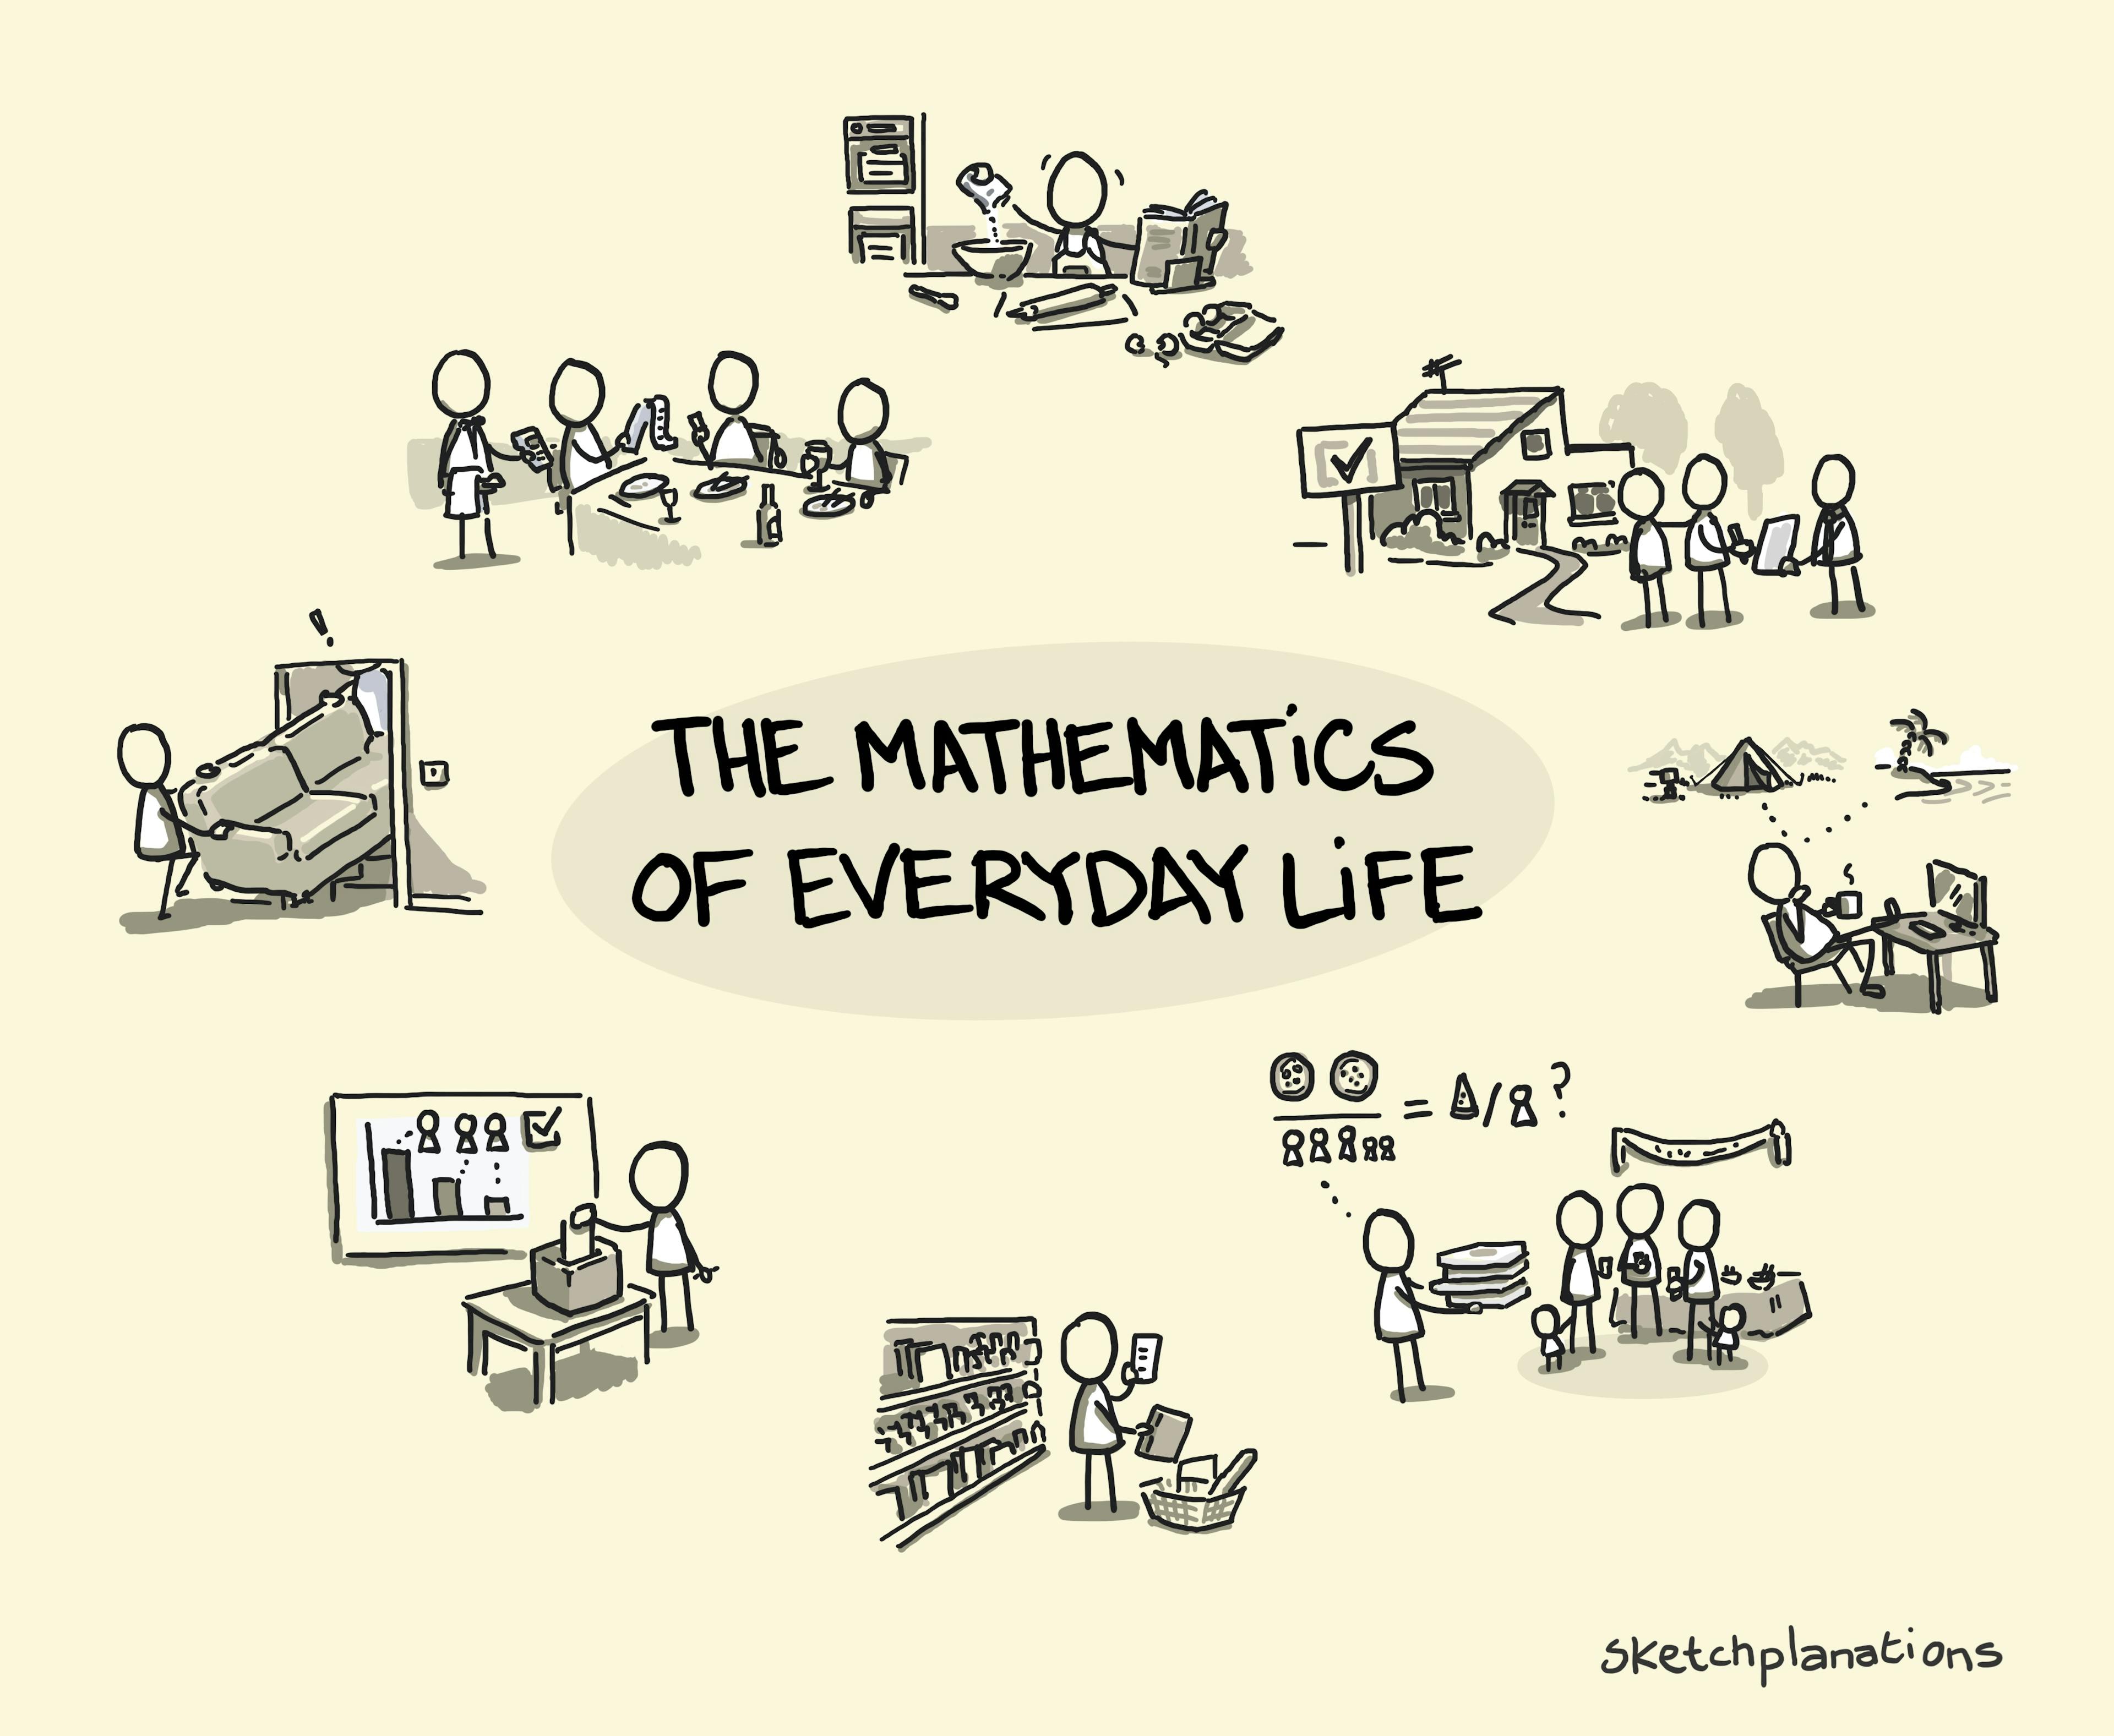
At school, it’s easy to think that mathematics is a somewhat arcane and abstract subject and that we don’t need to learn it. But I was surprised when I thought about all the times that knowing maths helps us in our everyday lives. Examples of everyday mathematics Here are some scenarios I noted over a few weeks, both where I personally ran into everyday maths challenges and where I noticed how much it matters: Travel and time Comparing the relative costs of holidays Deciding the cheapest or best way to get somewhere, balancing journey time, ease, cost, and comfort Estimating travel times to know when you can meet someone Converting between units when travelling (for example, miles and kilometres) Manipulating dates and shifting between time zones Homes and DIY Fitting furniture in a room, or checking whether a sofa will go up the stairs Estimating how many tiles you need for a bathroom Working out how much paint you need for a fence or wall Food and sharing Estimating the cost of your shopping and comparing value (this one’s buy one, get one half-price, but that one’s cheaper per 100g…) Splitting a bill at a restaurant Adapting recipes for different numbers of people Estimating food quantities for a party or a camping trip Converting weights and measures—oz to g, Fahrenheit and Celsius What I like to call “baguette maths”: dividing three baguettes between five people while keeping the largest intact sections Money and finances Understanding interest and return rates for savings and investments Comparing insurance policies Working out interest rates and monthly payments for a mortgage Financing a car and comparing deals Calculating tips Media and society Interpreting statistics in headlines, advertising claims, or medicines Understanding the maths behind political claims, arguments, and elections I’m sure you could add to the list—I didn’t even start on the sorts of metrics and measurements you might need at work. Thinking about these everyday moments matters. Difficulty with basic, practical maths doesn’t just affect school performance—it affects independence, confidence, and daily life. You might not need a Fourier transform or integration by parts for most of these. But facility with numbers, fractions and ratios, plus a little algebra and geometry, will go a long way toward making your life easier. In the case of the big financial decisions, like buying a house and deciding on your mortgage, just a little maths could make the difference of ten years of saving. And a little understanding of statistics can help temper wild advertising claims and misleading headlines. The VERDI Project I tried to capture a few of these in this sketch for Francesca Granone, Associate Professor at the University of Stavanger, and her co-researchers Glenn, Mia, Adam, Fionn and Mariagrazia who work on the project VERDI. The project is funded by Stiftelsen Dam and developed in cooperation with The Norwegian Association for Persons with Intellectual Disabilities (NFU) and aims to develop learning resources for everyday mathematics as a route to inclusion, particularly for people with Intellectual and Developmental Disabilities (IDD) such as autism or Down Syndrome. Traditional approaches to teaching mathematics don’t work for everyone, which can create challenges not just in learning environments but also in everyday life. An aim is to reduce unnecessary barriers to confidence and independence and improve the quality of life for a large group of people. Read more about the VERDI project or get in touch with Francesca. Mathematics isn’t all abstract theory; it’s also vital to making everyday life a little easier, fairer, and more enjoyable. Related Ideas to the Mathematics of Everyday Life Also see: Temperature Scales: Fahrenheit and Celsius Naismith’s Rule for estimating walking time in the mountains Sneaky averages Sampling Bias Parts of a circle The 9 times table on your fingers Asymmetry of returns BODMAS - order of operationsAt school, it’s easy to think that mathematics is a somewhat arcane and abstract subject and that we don’t need to learn it. But I was surprised when I thought about all the times that knowing maths helps us in our everyday lives. Examples of everyday mathematics Here are some scenarios I noted over a few weeks, both where I personally ran into everyday maths challenges and where I noticed how much it matters: Travel and time Comparing the relative costs of holidays Deciding the cheapest or best way to get somewhere, balancing journey time, ease, cost, and comfort Estimating travel times to know when you can meet someone Converting between units when travelling (for example, miles and kilometres) Manipulating dates and shifting between time zones Homes and DIY Fitting furniture in a room, or checking whether a sofa will go up the stairs Estimating how many tiles you need for a bathroom Working out how much paint you need for a fence or wall Food and sharing Estimating the cost of your shopping and comparing value (this one’s buy one, get one half-price, but that one’s cheaper per 100g…) Splitting a bill at a restaurant Adapting recipes for different numbers of people Estimating food quantities for a party or a camping trip Converting weights and measures—oz to g, Fahrenheit and Celsius What I like to call “baguette maths”: dividing three baguettes between five people while keeping the largest intact sections Money and finances Understanding interest and return rates for savings and investments Comparing insurance policies Working out interest rates and monthly payments for a mortgage Financing a car and comparing deals Calculating tips Media and society Interpreting statistics in headlines, advertising claims, or medicines Understanding the maths behind political claims, arguments, and elections I’m sure you could add to the list—I didn’t even start on the sorts of metrics and measurements you might need at work. Thinking about these everyday moments matters. Difficulty with basic, practical maths doesn’t just affect school performance—it affects independence, confidence, and daily life. You might not need a Fourier transform or integration by parts for most of these. But facility with numbers, fractions and ratios, plus a little algebra and geometry, will go a long way toward making your life easier. In the case of the big financial decisions, like buying a house and deciding on your mortgage, just a little maths could make the difference of ten years of saving. And a little understanding of statistics can help temper wild advertising claims and misleading headlines. The VERDI Project I tried to capture a few of these in this sketch for Francesca Granone, Associate Professor at the University of Stavanger, and her co-researchers Glenn, Mia, Adam, Fionn and Mariagrazia who work on the project VERDI. The project is funded by Stiftelsen Dam and developed in cooperation with The Norwegian Association for Persons with Intellectual Disabilities (NFU) and aims to develop learning resources for everyday mathematics as a route to inclusion, particularly for people with Intellectual and Developmental Disabilities (IDD) such as autism or Down Syndrome. Traditional approaches to teaching mathematics don’t work for everyone, which can create challenges not just in learning environments but also in everyday life. An aim is to reduce unnecessary barriers to confidence and independence and improve the quality of life for a large group of people. Read more about the VERDI project or get in touch with Francesca. Mathematics isn’t all abstract theory; it’s also vital to making everyday life a little easier, fairer, and more enjoyable. Related Ideas to the Mathematics of Everyday Life Also see: Temperature Scales: Fahrenheit and Celsius Naismith’s Rule for estimating walking time in the mountains Sneaky averages Sampling Bias Parts of a circle The 9 times table on your fingers Asymmetry of returns BODMAS - order of operationsWWW
Read more…


