

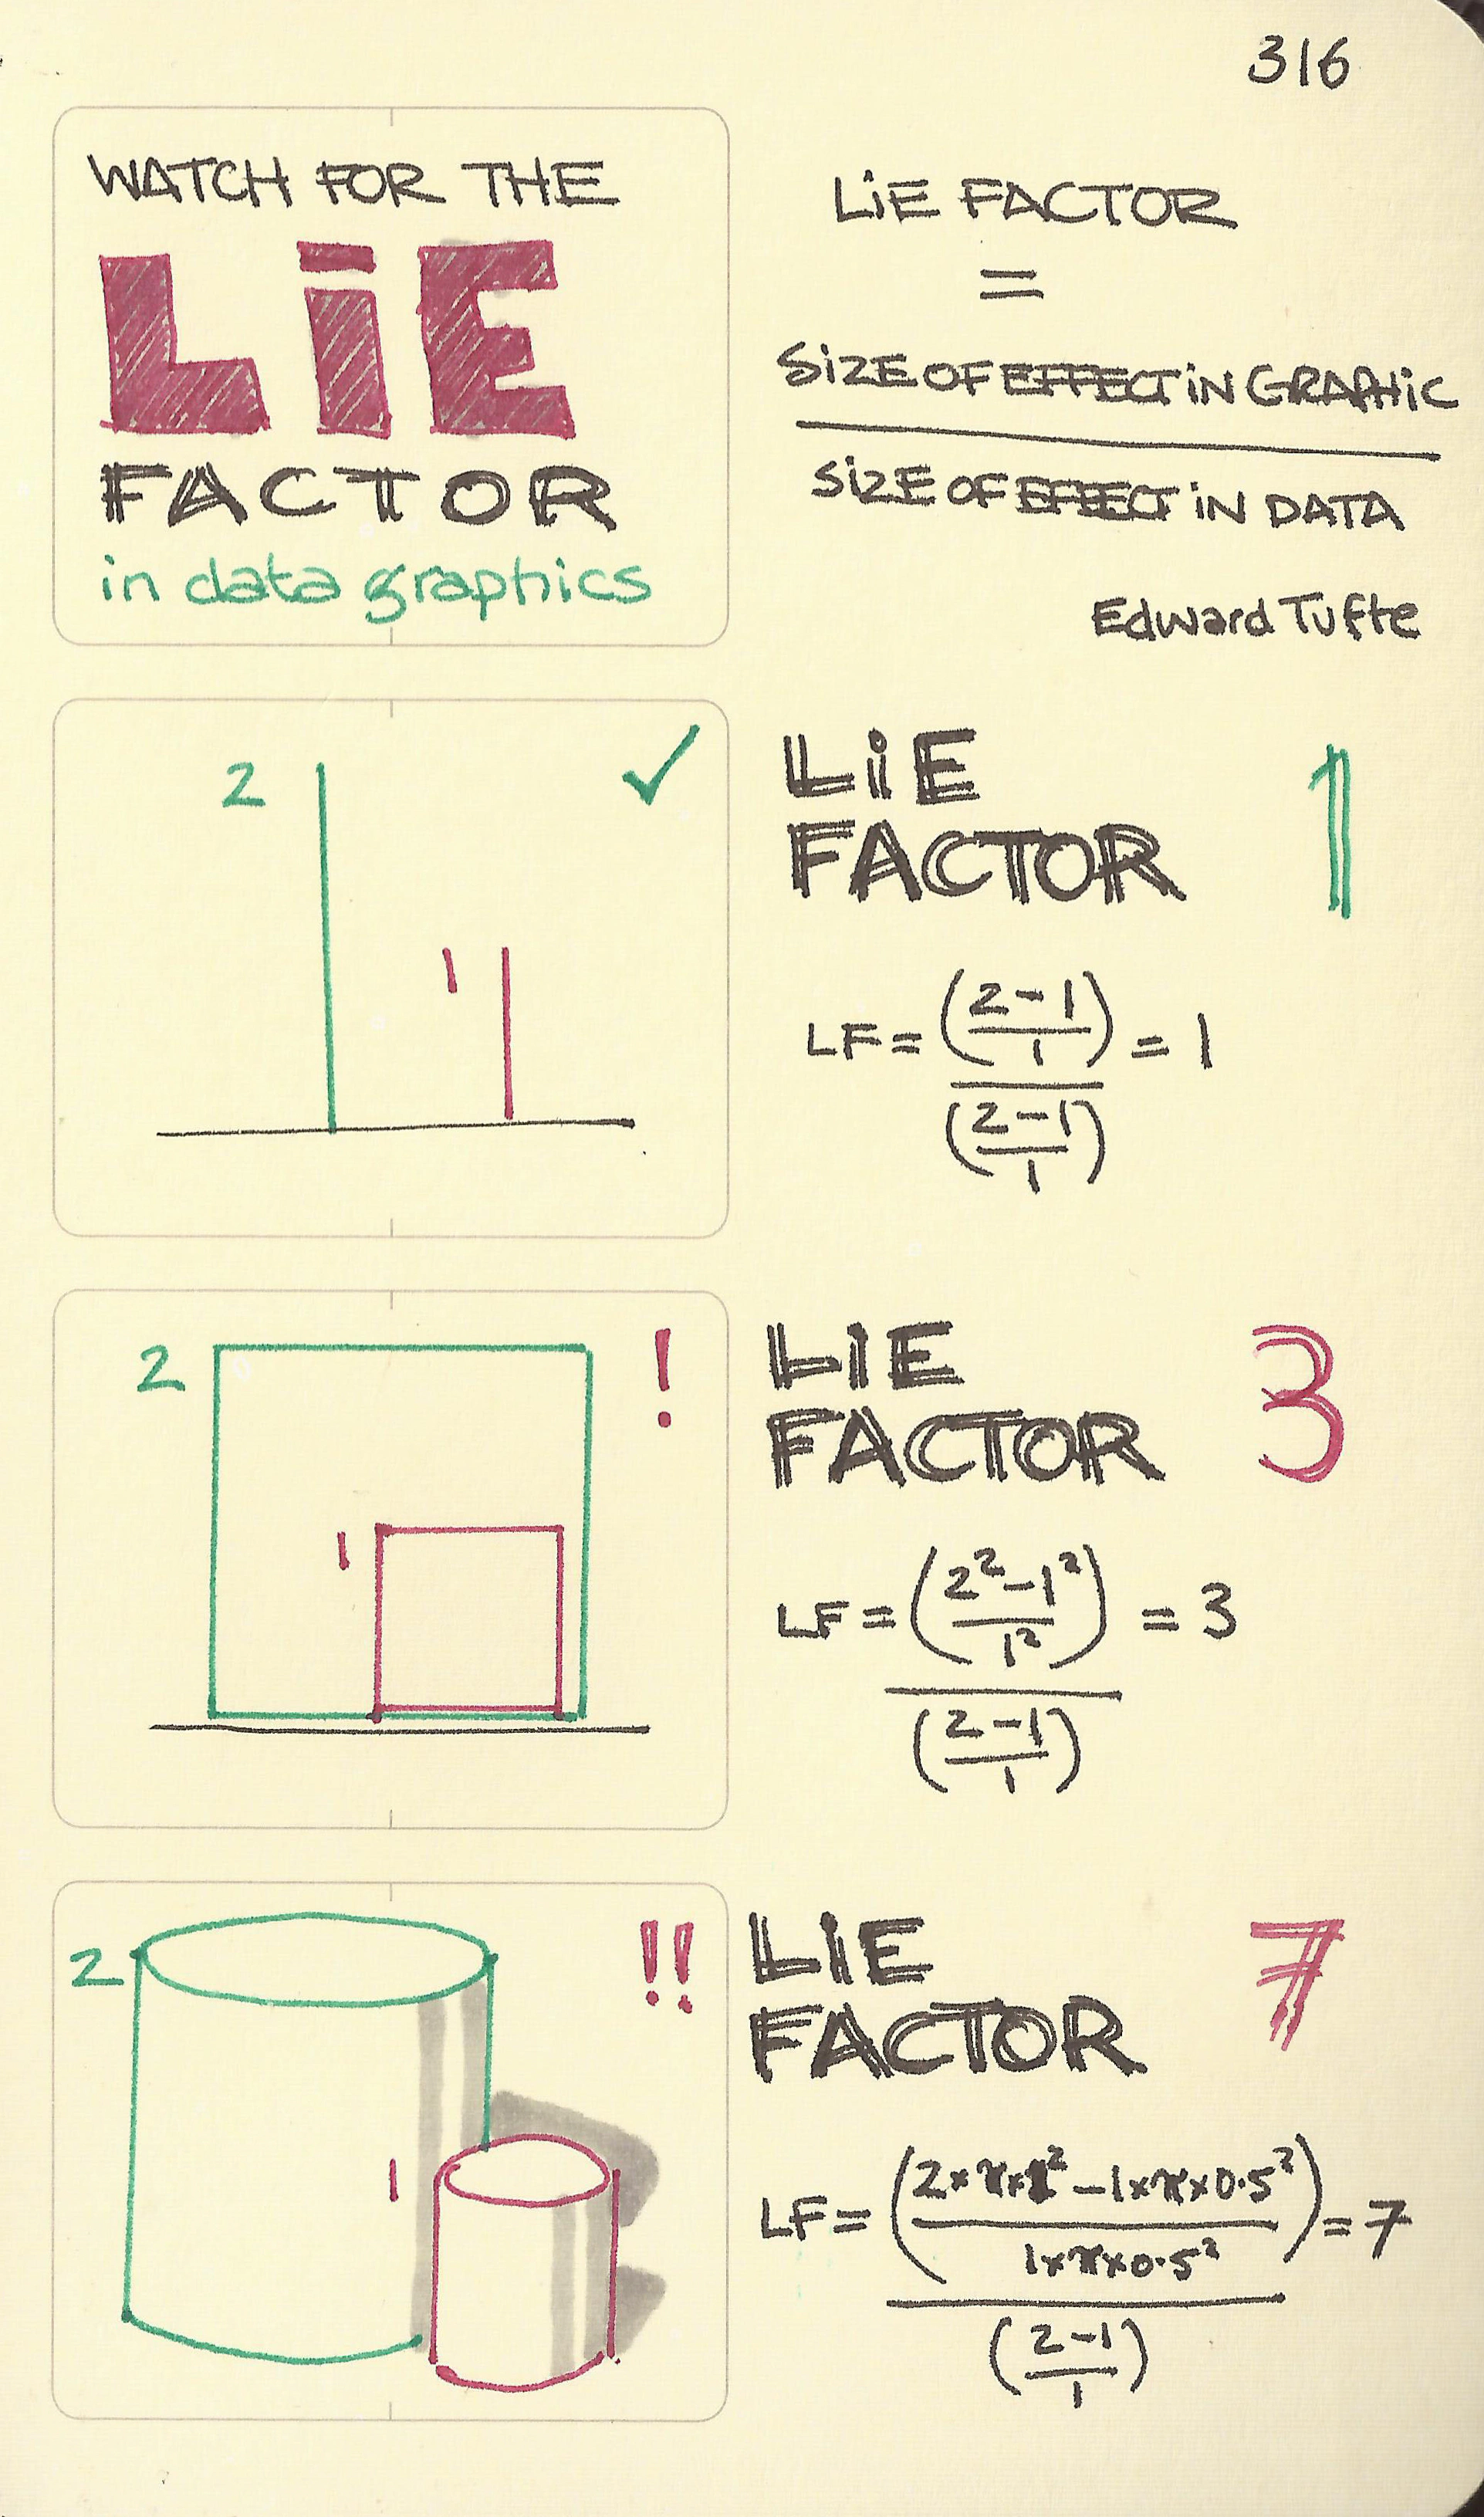
Watch for the lie factor
- Download
- Copied!
👇 Get new sketches each week
Data graphics can lie in many ways, but the most common, I expect, is the error of using area or volume objects to represent one-dimensional data.
More data visualisation principles from Edward Tufte.
Also, see Maximise data ink
Published
Back to top