Iceberg orientation

👇 Get new sketches each week
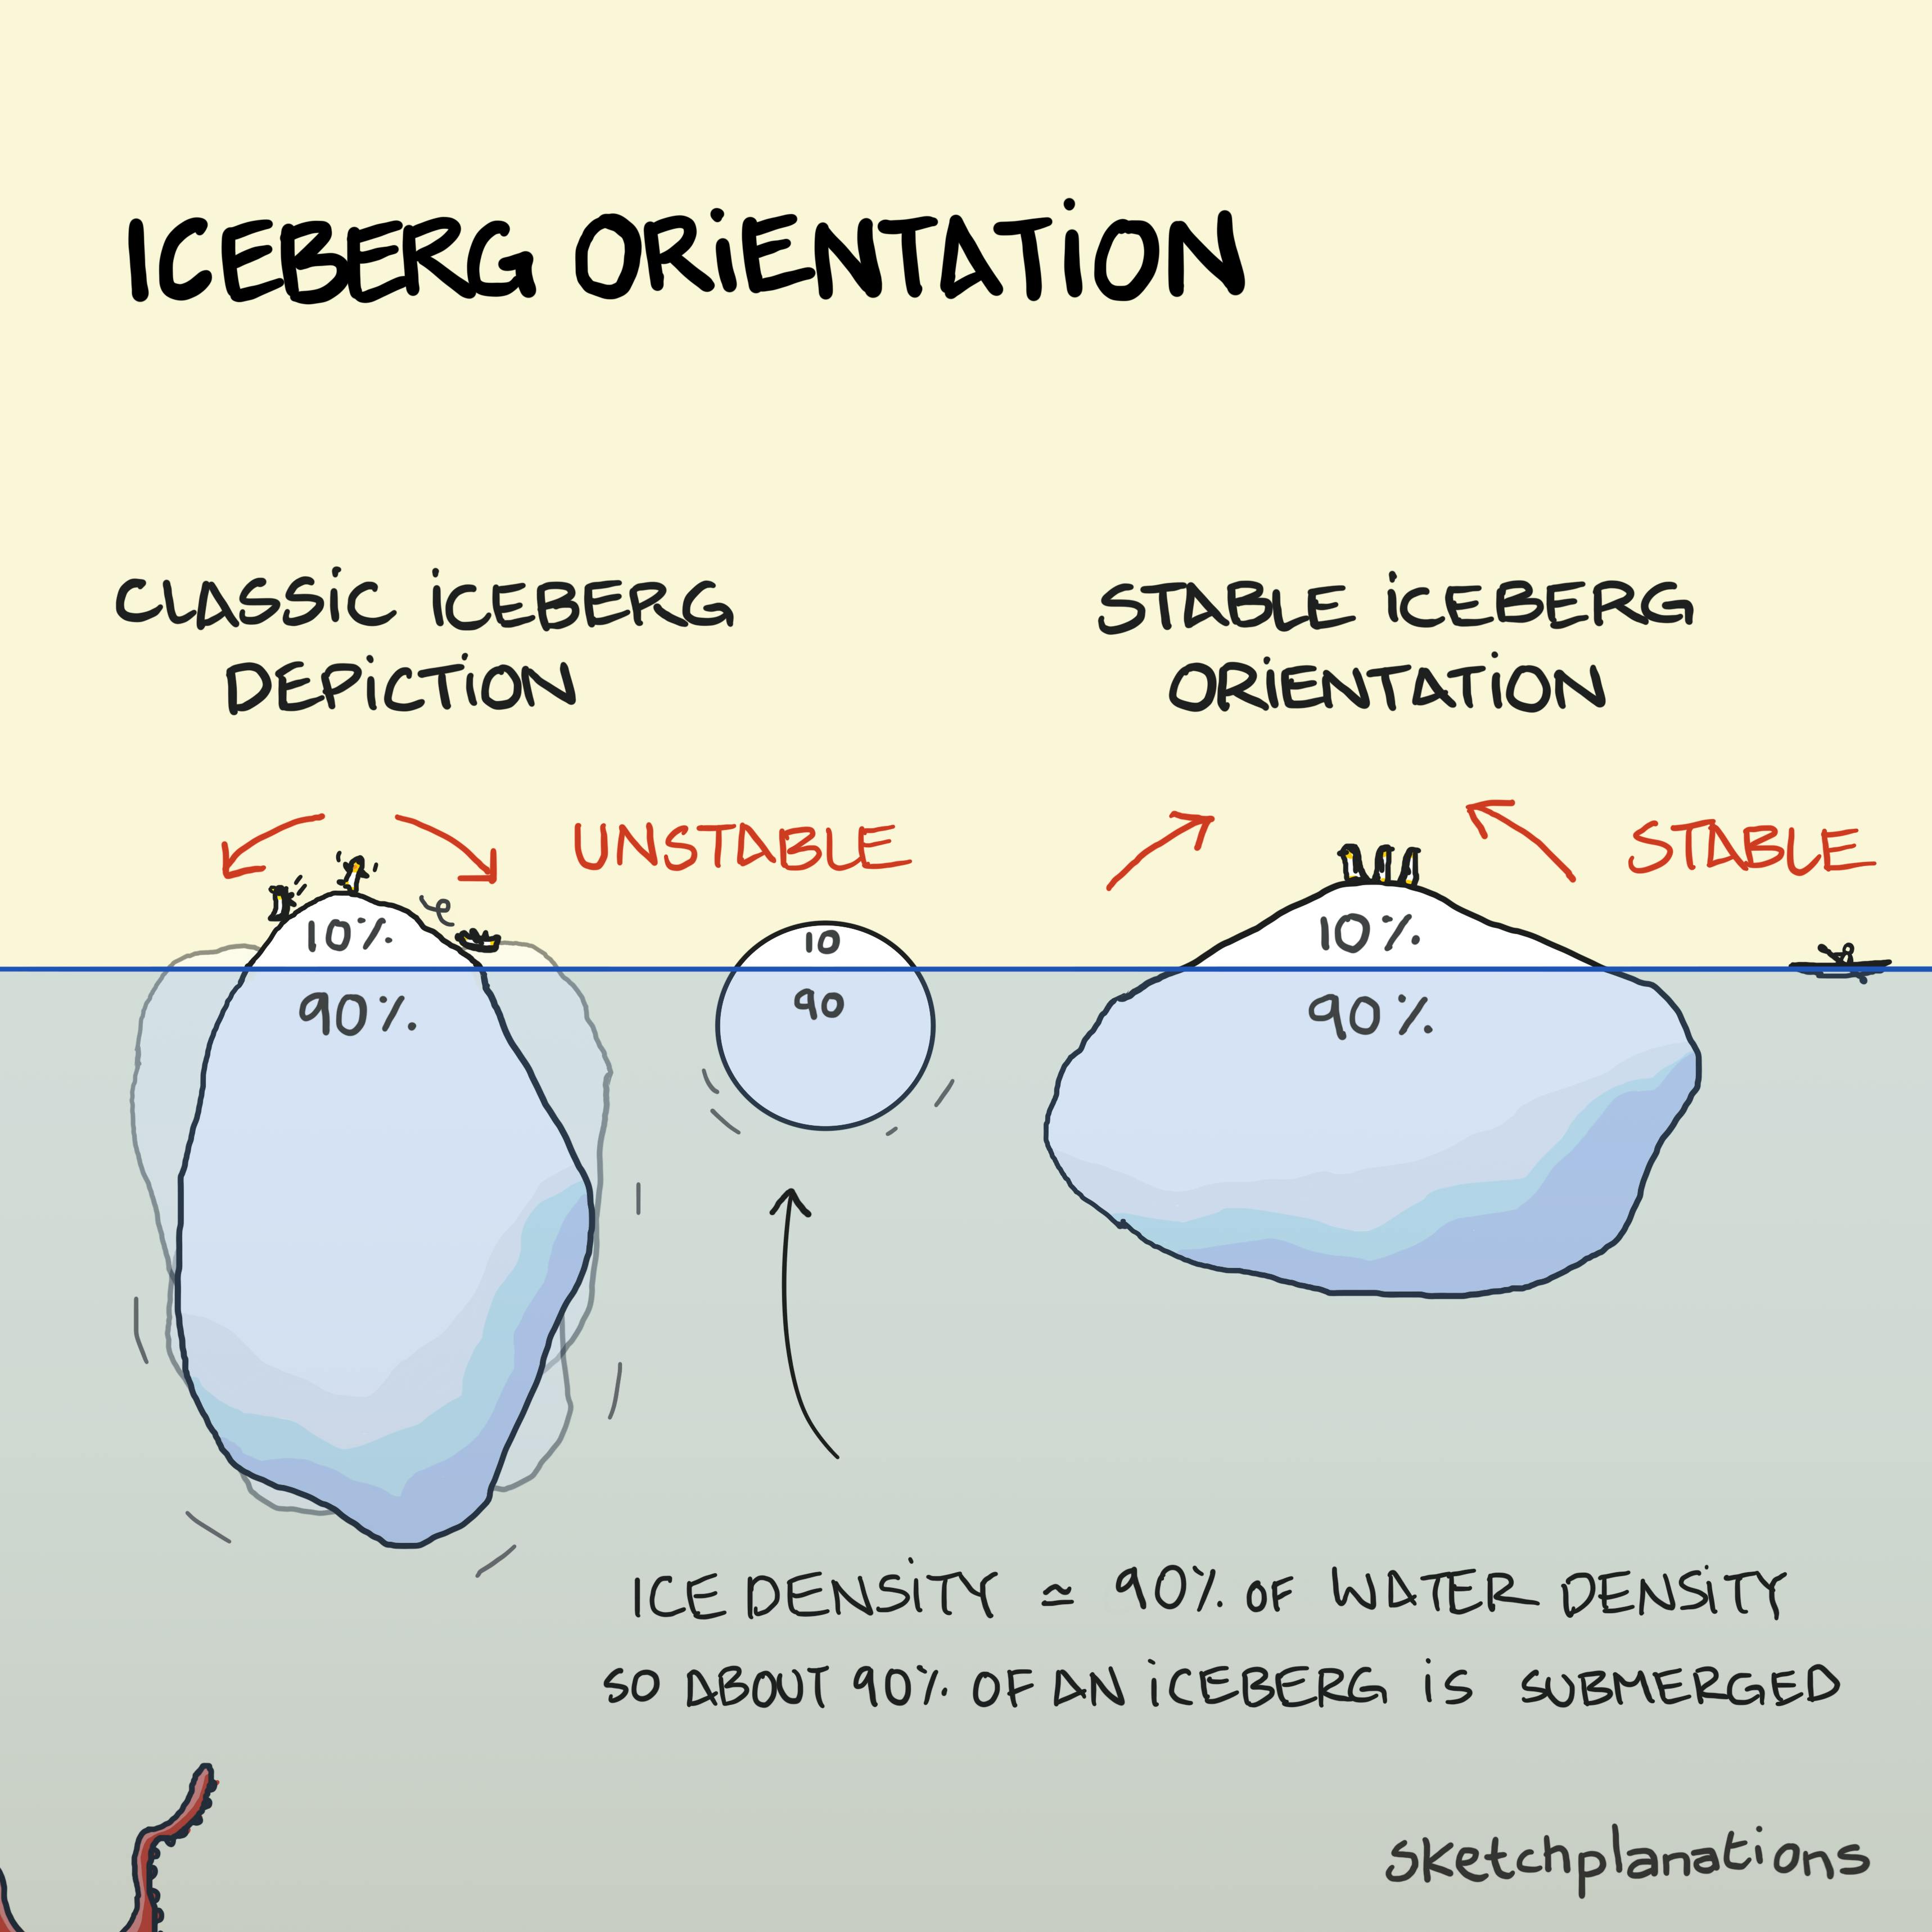
Nearly every iceberg you see in a picture or diagram is probably floating the wrong way. This was what I learned (from Megan Thompson-Munson ) after sketching Biz Stone's brilliant saying about the myth of overnight success.
With some approximation, the density of ice is around 900 kg/m3, and seawater is around 1,000 kg/m3. Therefore, the fraction of an iceberg that's submerged is around ~900/1000 or 0.9. So, about 90% of an iceberg is below the surface and 10% above, which is partly why they can be so dangerous. While most iceberg pictures get this part more or less correct, most of these icebergs will be floating vertically. In reality, a tall, thin iceberg will likely topple, so most icebergs end up floating on their side, not their tips, even though we rarely draw them this way.
I remember learning about a fascinating experiment with children of different ages estimating which glass holds more water: a tall, slender one filled high or a wider glass filled to a lower level. Younger children almost always chose the glass with the higher water level as the most water, even when it was significantly less than the shorter and wider glass. I wonder if it's part of why we draw icebergs vertically, at least when we're using them as a metaphor. It's easier to grasp quantities vertically, and we commonly underestimate volume spread over a wider area.
We may still want to draw our icebergs tall and deep to make our point, but now, at least, we can do so with the knowledge that they're not like the real ones.
If you want to see it yourself, Joshua Tauberer made a brilliant draw-an-iceberg-and-see-how-it-will-float game . I recommend you give it a go so it sinks in forever (sorry).
Also see:
- Overnight success
- Why ice doesn't sink
- Ice-cream, gelato, sorbet
- Know your poles: penguins or polar bears, frozen ice or land

