The Mercator projection

👇 Get new sketches each week
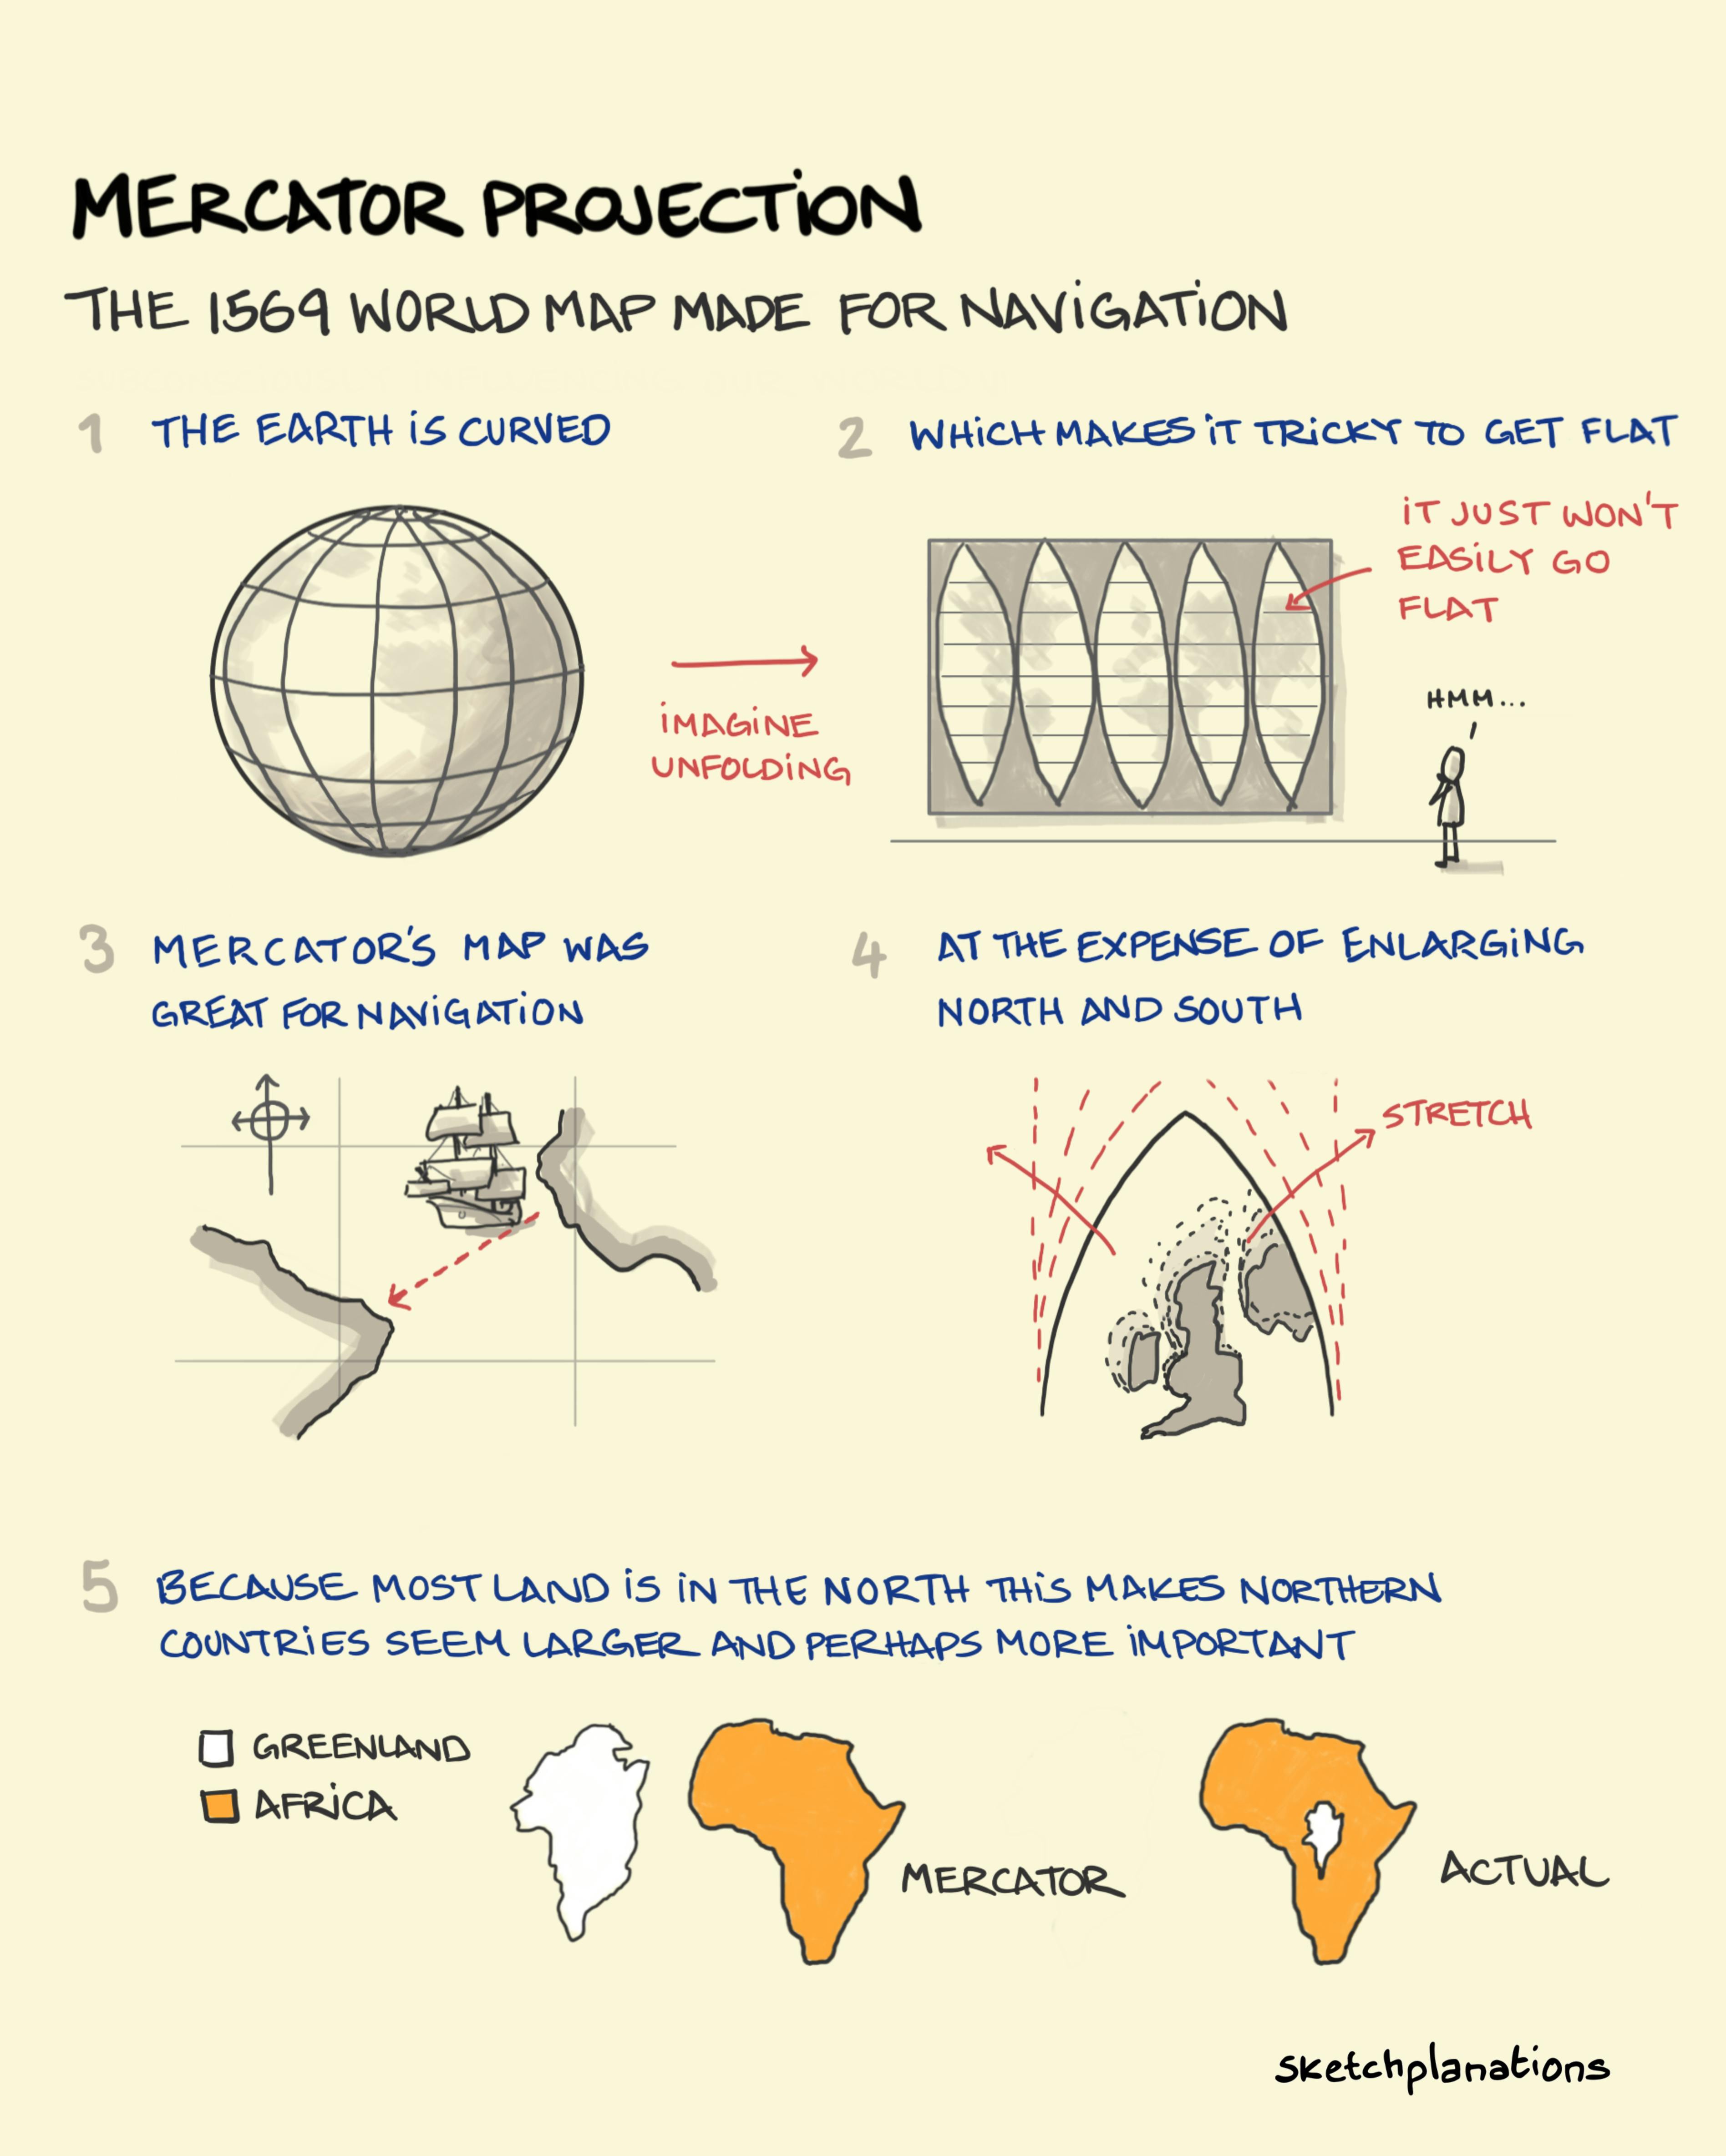
All maps involve decisions. Whenever you compress real life onto something smaller and less detailed you have to choose what to keep in and what to leave out. And in the case of printing a map of the Earth, you have to figure out how to get something that is curved onto something that is flat, and this involves trade-offs and decisions as well. 3 dimensional space just doesn’t flatten to 2 dimensional paper without choices.
In 1569 Gerardus Mercator created a map that brilliantly solved a pressing problem — that of being able to follow a straight line while sailing and it correspond to a straight line on the map. His map also did a good job of preserving the shape of countries.
But to do this you have to stretch the areas at the top and bottom of the Earth. Because most of the land on Earth is in the Northern hemisphere, and because that land is generally further north than the land in the southern hemisphere is south, it has the effect of enlarging Northern countries such as Europe, the US and Canada, Scandinavia and Russia as compared to countries closer to the equator and in the Southern hemisphere.
Most world maps you see are still similar to Mercator’s projection. In fact Google Maps desktop used it until 2018 .
It could well be that this distorts our worldview by emphasizing Northern countries in size and therefore importance. When I see a more size accurate Gall-Peters projection I have to say it’s hard to argue.
The West Wing did this brilliantly .
I updated this sketch for my book Big Ideas Little Pictures

